Diet Research Data:Effects of High-Fat Diets with Different Fat Sources on Male F344 and SD Rats
5.Fasting blood glucose and plasma insulin concentrations
6.Concentrations of blood lipid metabolism-related substances
8.Hepatic triglyceride content and liver tissue histology
Related CLEA Japan product: CE-2

For the animal, please click here↓![]() : https://www.clea-japan.com/en/products/general_diet/item_d0030
: https://www.clea-japan.com/en/products/general_diet/item_d0030
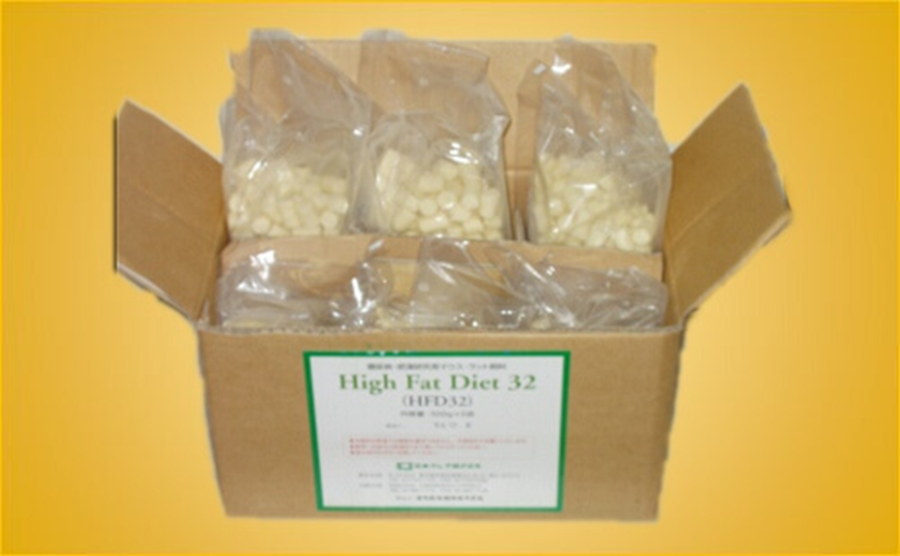
Related CLEA Japan product: High Fat Diet 32
For the animal, please click here↓![]() : https://www.clea-japan.com/en/products/general_diet/item_d0080
: https://www.clea-japan.com/en/products/general_diet/item_d0080
Inquiry:
If you have any question, please feel free to contact us from here.
1.Objective
The purpose of this study was to examine the effects of high-fat diets with different fat sources on obesity and hepatic triglyceride content in rats.
2.Materials and Methods
(1)Experimental Site
The experiment was conducted in the conventional rat breeding room of the Central Research Laboratory, Nippon Compound Feed Manufacturing Co., Ltd. (Nippon Compound Feed).
(2)Diets
A commercial control diet (CE-2, Clea Japan) and three experimental high-fat diets were used. The experimental diets were formulated by replacing the safflower oil in the High Fat Diet 32 (HFD32, Clea Japan) with lard (HFD-La) or palm oil (HFD-Pa). Additional fat sources included powdered beef tallow. The characteristics of the diets are summarized in Tables 1-3.
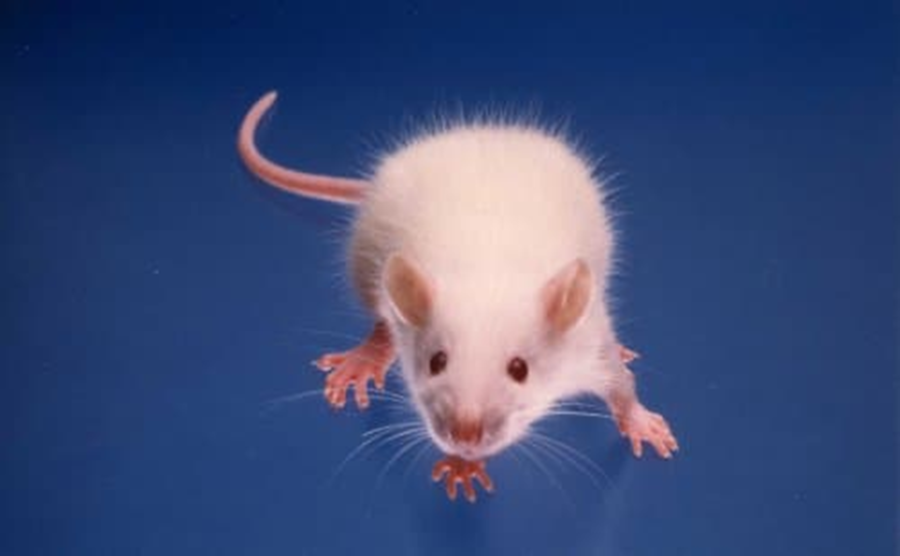
(3)Animals
Two strains of 5 weeks of age male rats, F344/Jcl and Jcl:SD, were used (n=6 per group).
(4)Housing Conditions
- Temperature and humidity: 21-25°C, 40-60% humidity
- Lighting: 12-hour light-dark cycle (lights on 9:00-21:00)
- Cages: Two rats were housed per polycarbonate cage containing sterilized chips.
- Feed: Ad libitum
- Drinking water: Ad libitum
(5)Experimental Procedures
Animal Introduction and Acclimatization: Four weeks of age F344/Jcl and Jcl:SD rats were introduced and acclimatized for one week. After acclimatization, the rats were randomly divided into four groups based on body weight to ensure equal group sizes. Two rats were housed per cage.
Experimental Diet: The experimental diets were administered from 5 to 9 weeks of age.
Sacrifice and Sample Collection: After an overnight fast (approximately 15 hours), the rats were euthanized. Blood samples were collected for the measurement of blood glucose, plasma insulin, and serum lipid parameters (total cholesterol, HDL-cholesterol, triglycerides, and free fatty acids). The livers were collected for the measurement of triglyceride content and histological examination using hematoxylin and eosin staining.
Statistical Analysis: Turkey-Kramer test was used for statistical analysis.
3.Results
The results are presented below.
1.Feed composition
Table 1: Composition of Experimental Diets
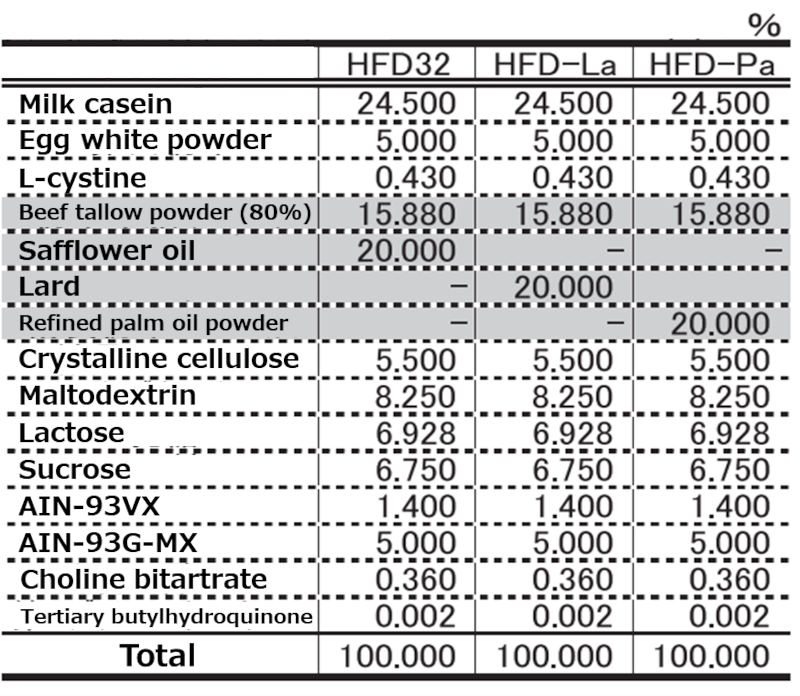
Table 2: General Compositional Analysis of Experimental Diets
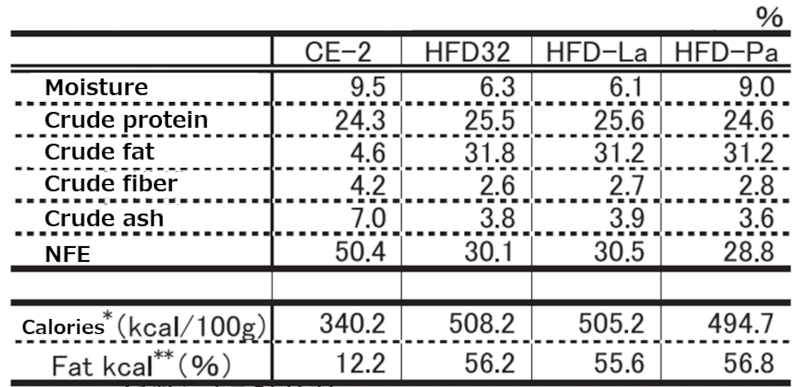
*Calculated value using the 4-9-4 factor
**Percentage of calories derived from fat
Table 3: Fatty Acid Composition of High-Fat Diets
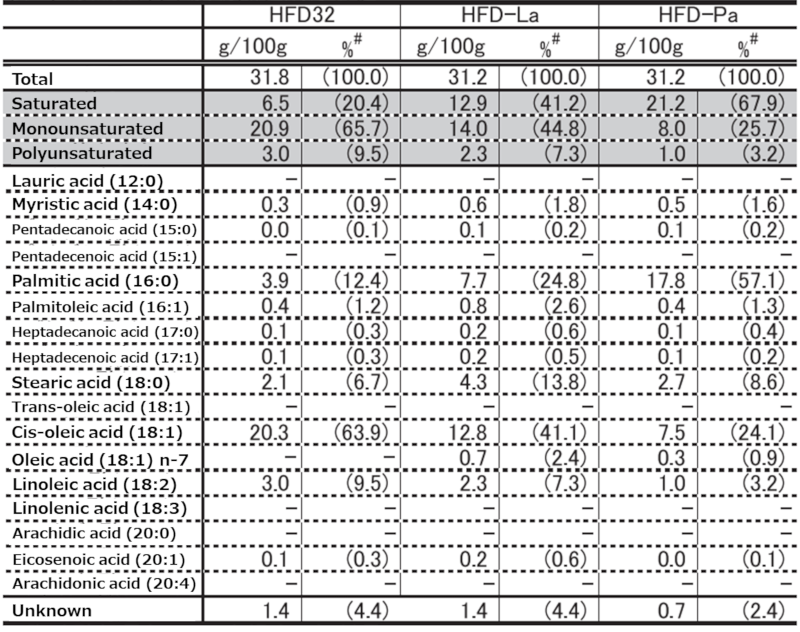
#Relative amounts when total fatty acids are normalized to 100
2.Food intake
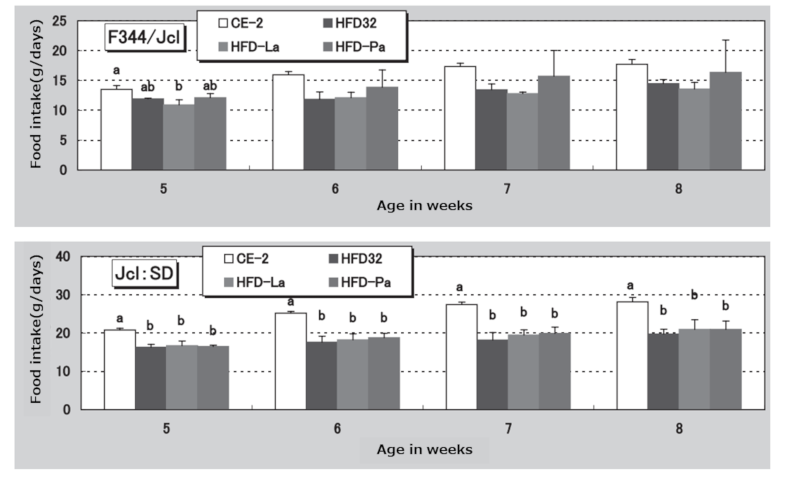
Figure 1. Changes in food intake over time.
Bars and vertical lines represent the mean ± standard error. Statistical analysis was performed between groups at the same age, and different symbols indicate significant differences (p < 0.05).
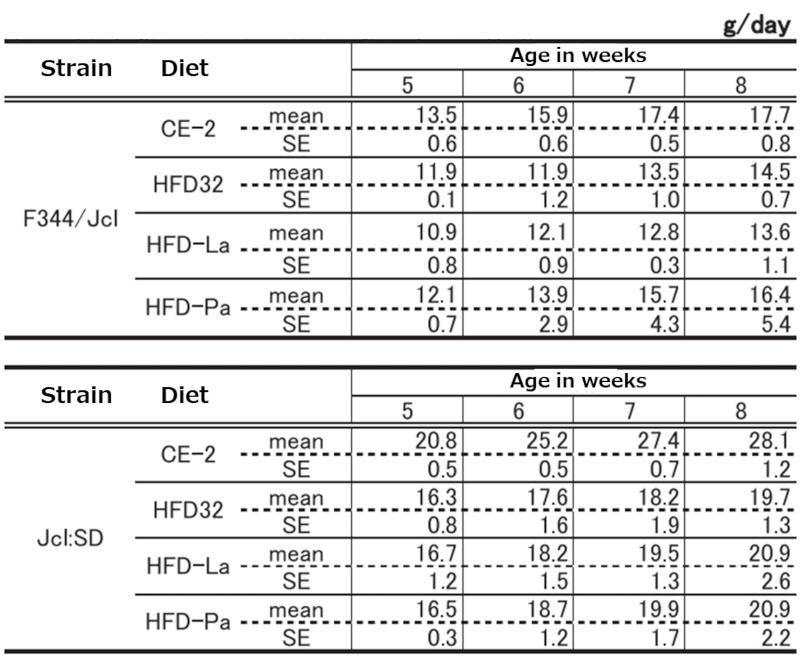
Table 4: Changes in Food Intake in Rats of Each Strain
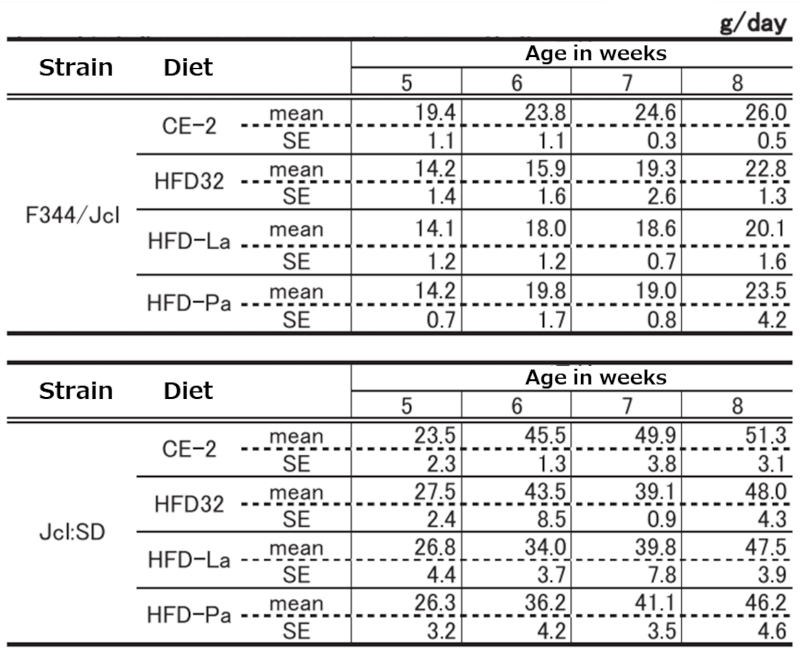
3.Water intake
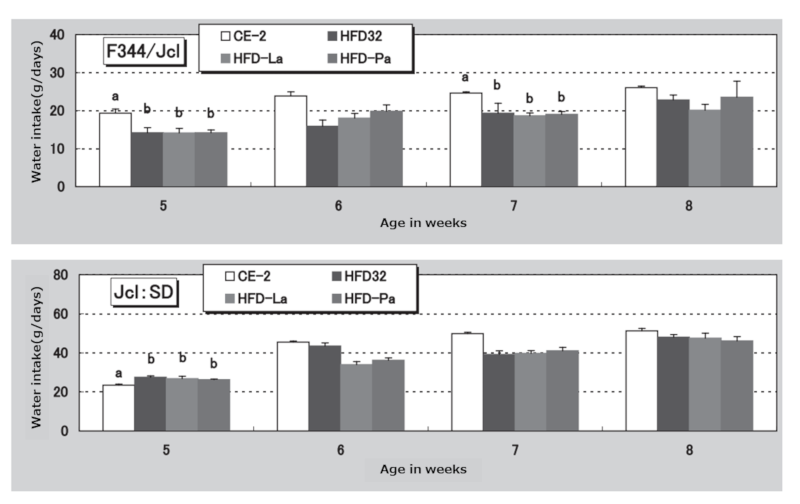
Figure 2. Changes in water intake over time.
Bars and vertical lines represent the mean ± standard error. Statistical analysis was performed between groups at the same age, and different symbols indicate significant differences (p < 0.05).
Table 5: Changes in Water Intake in Rats of Each Strain
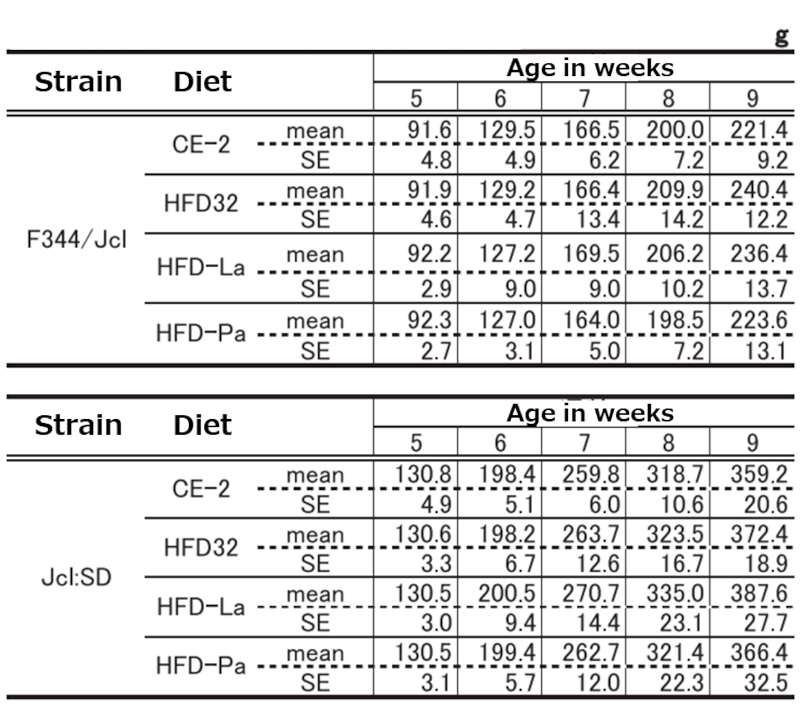
4.Body weight
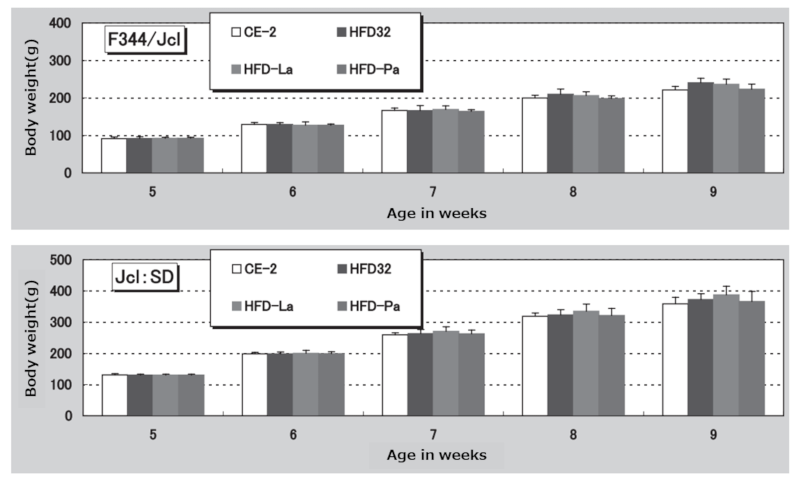
Figure 3. Body weight.
Body weight was measured weekly. Bars and vertical lines represent the mean ± standard error.
Table 6: Changes in Body Weight in Rats of Each Strain
5.Fasting blood glucose and plasma insulin concentrations
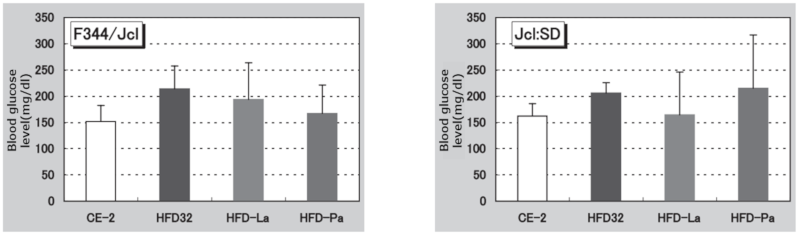
Figure 4. Fasting blood glucose levels.
Fasting blood glucose levels were measured at the time of sacrifice at 9 weeks of age. Bars and vertical lines represent the mean ± standard error.
Table 7: Fasting Blood Glucose Levels in Rats of Each Strain
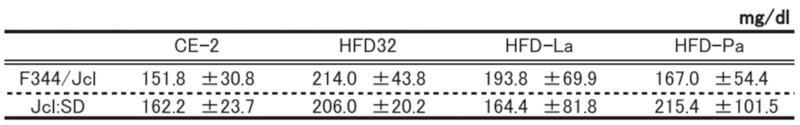
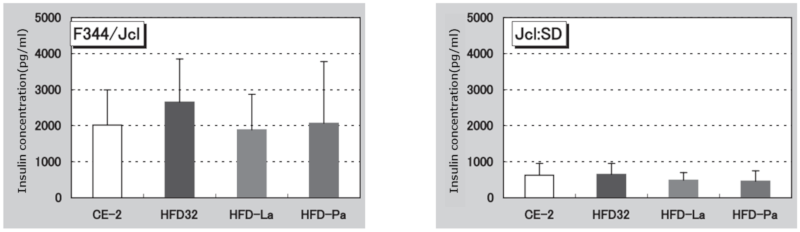
Figure 5. Fasting plasma insulin levels.
Fasting plasma insulin levels were measured at the time of sacrifice at 9 weeks of age. Bars and vertical lines represent the mean ± standard error.
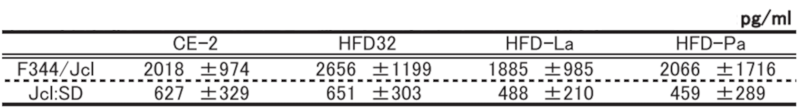
Table 8: Fasting Plasma Insulin Concentrations in Rats of Each Strain
6.Concentrations of blood lipid metabolism-related substances
Table 9: Concentrations of Blood Lipids and Related Substances
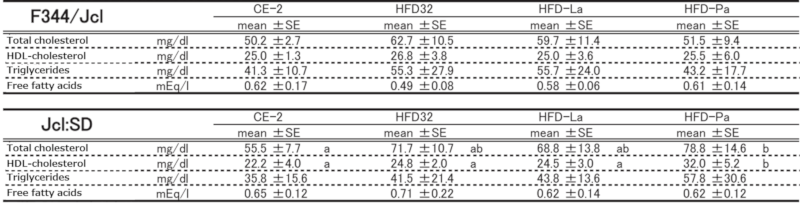
Significant differences between groups with different symbols (p < 0.05)
7.Organ weight
Table 10: Body Weight and Relative Organ Weights
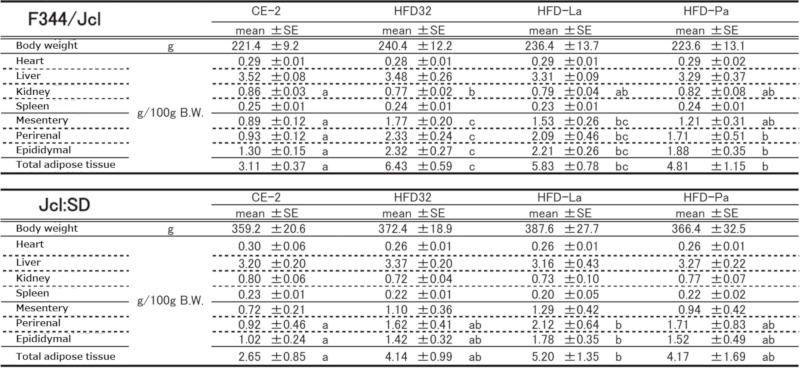
Significant differences between groups with different symbols (p < 0.05)
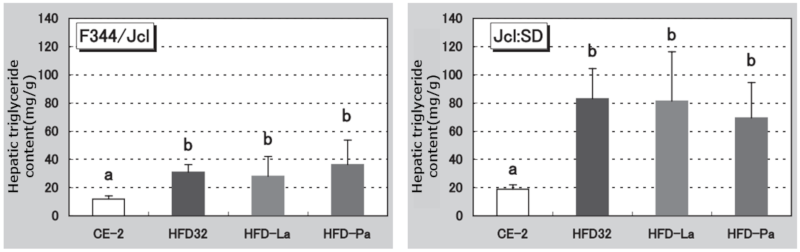
Figure 6. Hepatic triglyceride content at the time of sacrifice.
Hepatic triglyceride content was measured in liver tissues collected at the time of sacrifice at 9 weeks of age. Bars and vertical lines represent the mean ± standard error. Different symbols indicate significant differences (p < 0.05).
8.Hepatic triglyceride content and liver tissue histology
Table 11: Hepatic Triglyceride Content in Rats of Each Strain
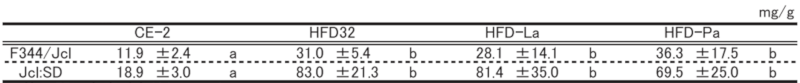
Significant differences between groups with different symbols (p < 0.05)
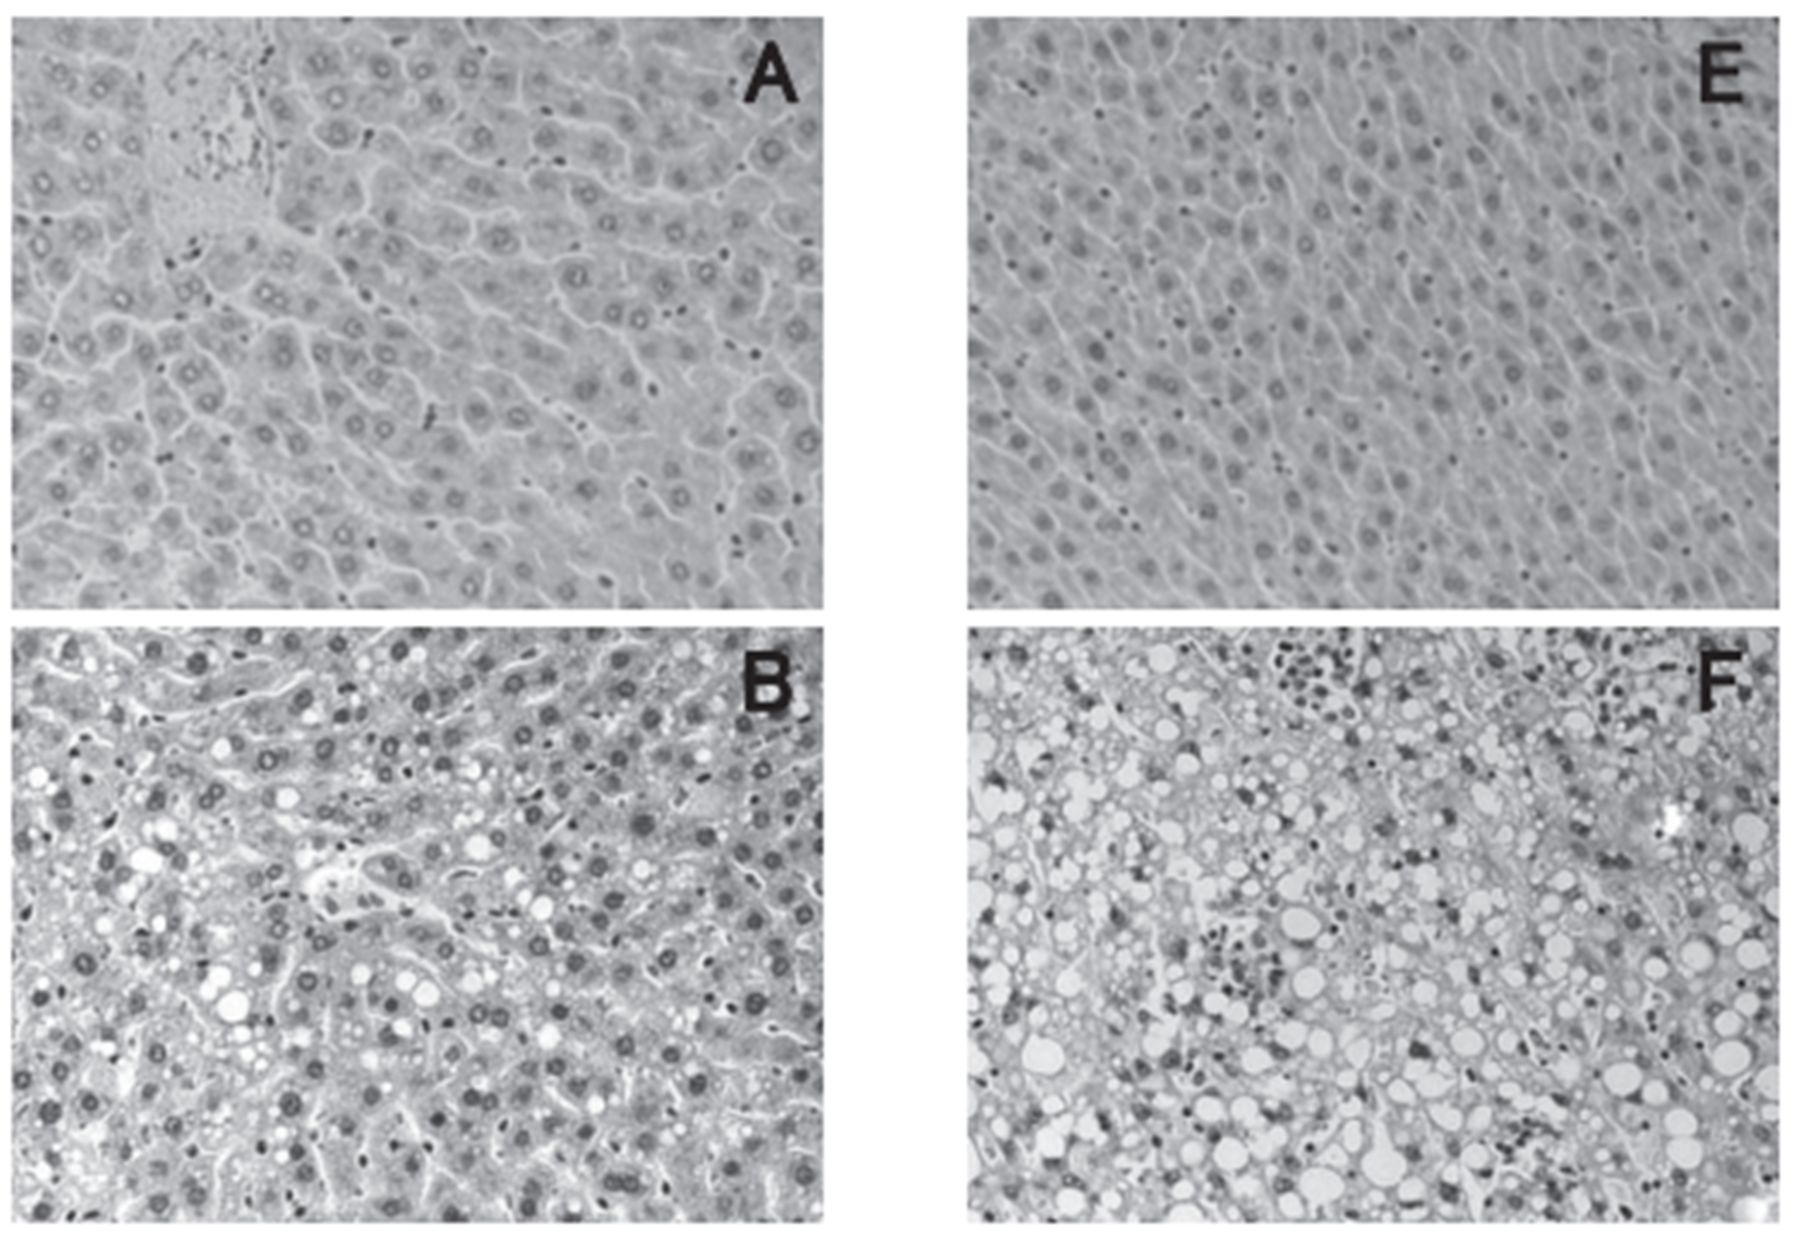
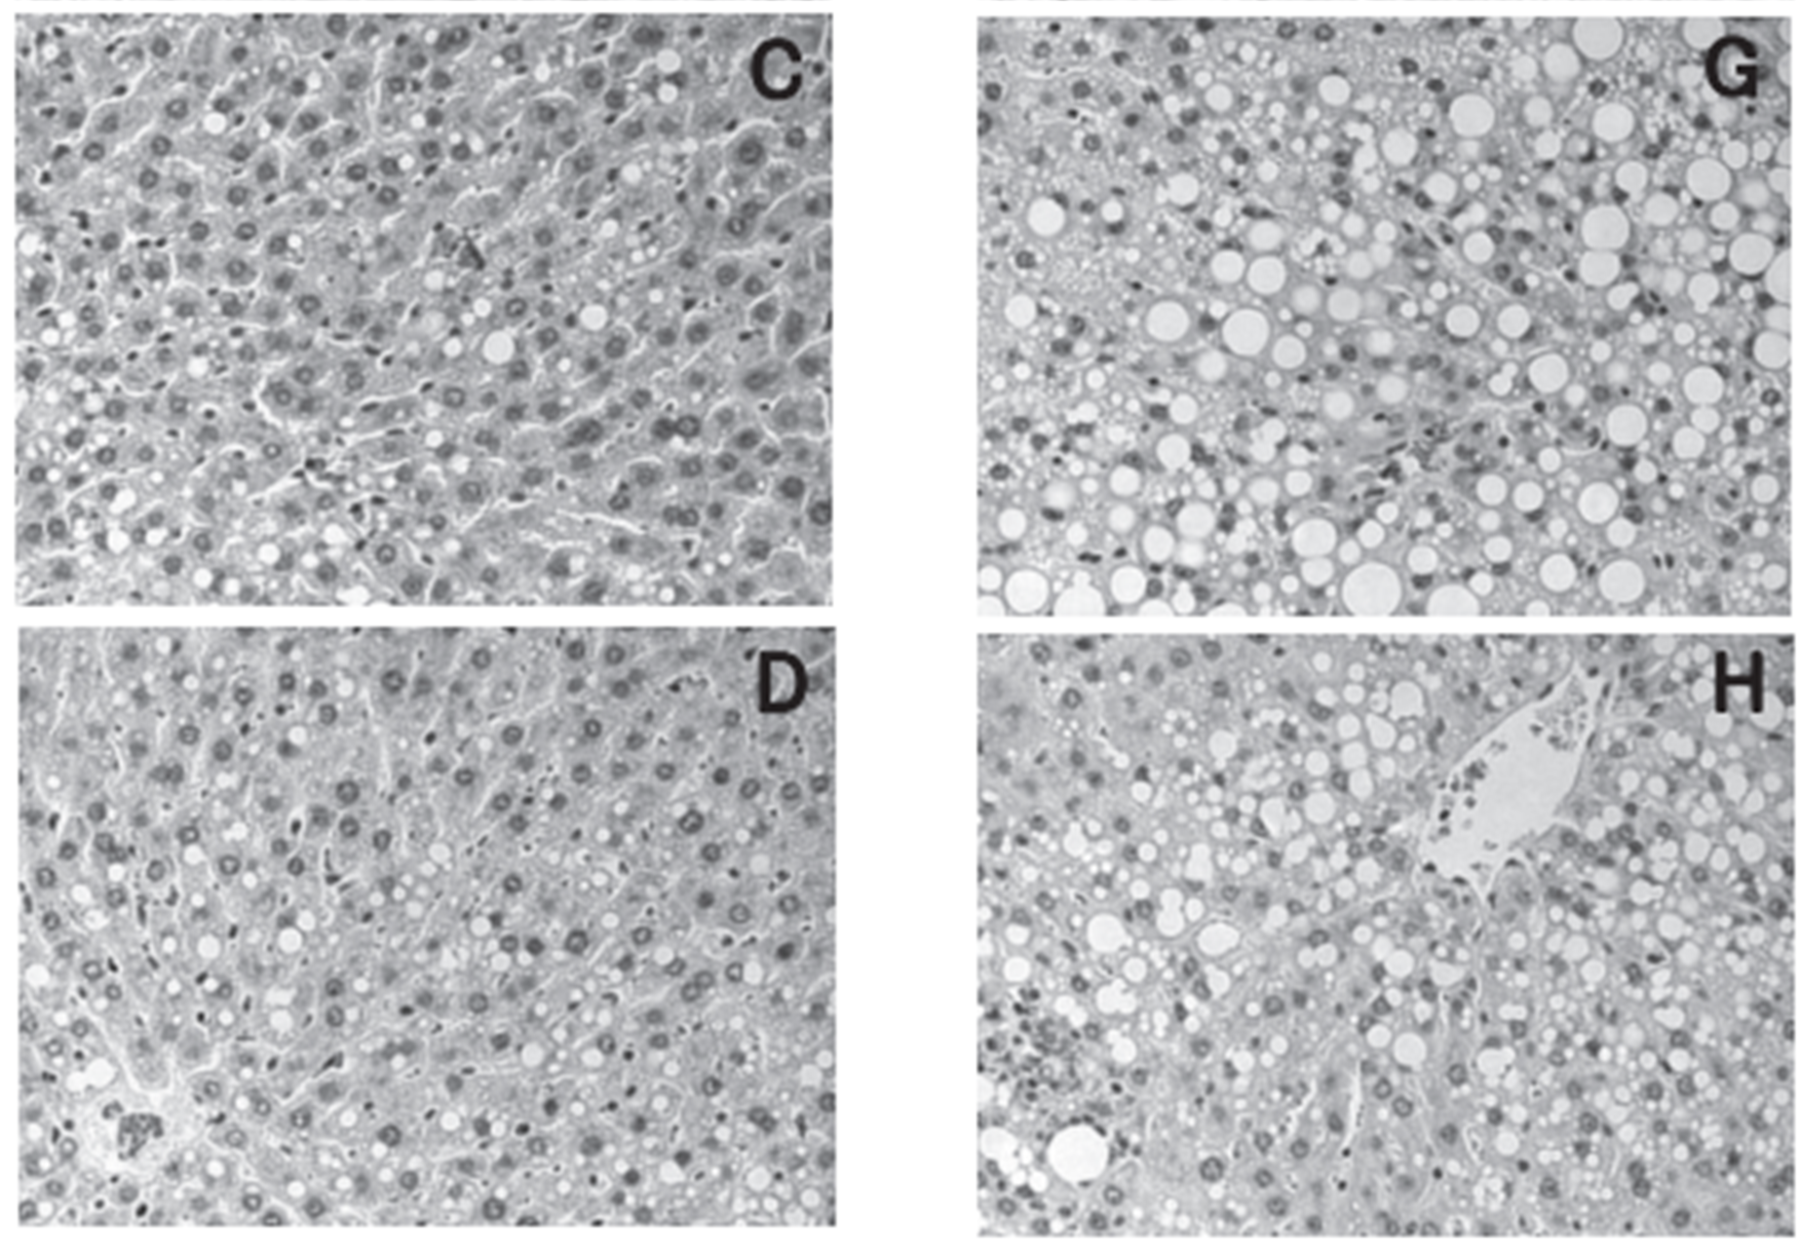
Figure 7. Liver histology (×400).
A-D: F344/Jcl, E-H: Jcl:SD liver tissues.
A: CE-2 group, B: HFD32 group, C: HFD-La group, D: HFD-Pa group, E: CE-2 group, F: HFD32 group, G: HFD-La group, H: HFD-Pa group.