Diet Research Data:Effects of high-carbohydrate diets with different carbohydrate sources on male F344 and SD rats
5.Results of oral glucose tolerance test
6.Concentrations of blood lipids and related substances
8.Hepatic triglyceride content and liver histology
Related CLEA Japan product: AIN-93G

For the animal, please click here↓![]() : https://www.clea-japan.com/en/products/special_diet/item_d0220
: https://www.clea-japan.com/en/products/special_diet/item_d0220
Inquiry:
If you have any question, please feel free to contact us from here.
1.Objective
In this study, we investigated the effects of feeding rats high-carbohydrate diets with different types of carbohydrates on obesity, glucose tolerance, and hepatic triglyceride content.
2.Materials and Methods
(1)Experimental site
The experiments were conducted in the rat breeding room (conventional) of the Central Research Institute, Nippon Compound Feed Manufacturing Co., Ltd.
(2) Diets (characteristics shown in Tables 1 and 2)
AIN-93G was used as the control diet, and high-carbohydrate diets containing mainly glucose (H-Glu), sucrose (H-Suc), or fructose (H-Fru) were used as experimental diets. H-Glu, H-Suc, and H-Fru were based on AIN-93G. Corn starch was mainly used as an additional carbohydrate source.
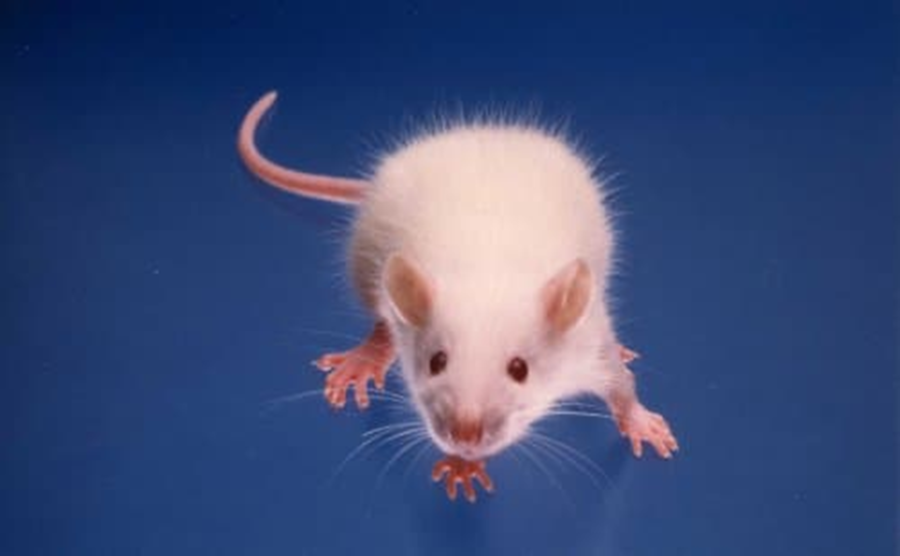
(3)Animals
Two strains of 5-week-old male rats, F344/Jcl and Jcl:SD, were used (n=10).
(4)Housing conditions
- Temperature and humidity: Temperature was maintained at 21-25°C, and humidity at 40-60%.
- Lighting: A 12-hour light/dark cycle was used (lights on 9:00 AM - 9:00 PM).
- Caging: Rats were housed two per cage in polycarbonate cages containing sterilized chips.
- Diet: Rats had ad libitum access to diet.
- Water: Rats had ad libitum access to tap water.
(5)Experimental procedures
Four-week-old male F344/Jcl and Jcl:SD rats were acclimatized for one week and then randomly divided into four groups based on body weight. Two rats were housed per cage. Experimental diets were provided from 5 to 13 weeks of age. Oral glucose tolerance tests were conducted at 8 and 12 weeks of age. At 9 and 13 weeks of age, four and six rats per group, respectively, were fasted overnight (approximately 15 hours) and then sacrificed. Blood samples were collected and analyzed for serum lipids (total cholesterol, HDL-cholesterol, triglycerides, and free fatty acids). Livers were collected, and hepatic triglyceride content was measured. Histological examination was performed using hematoxylin and eosin staining. Statistical analysis was performed using the Turkey-Kramer test.
3.Results
The results are presented below.
1.Composition of diets
Table 1. Composition of experimental diets
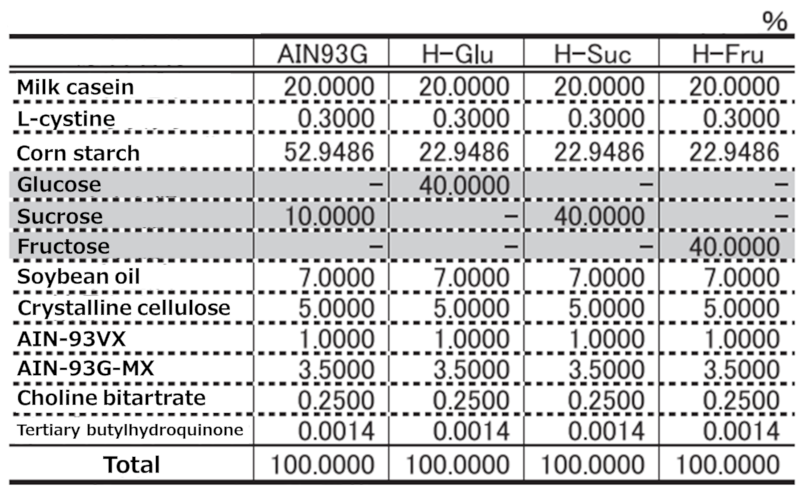
#: Partially replaced with α-corn starch
Table 2. General composition of experimental diets
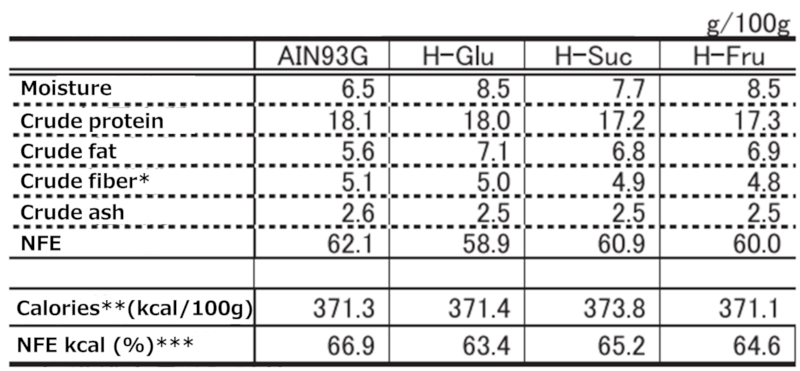
**Calculated using the 4.94 factor.
***Percentage of calories derived from NFE in total calories.
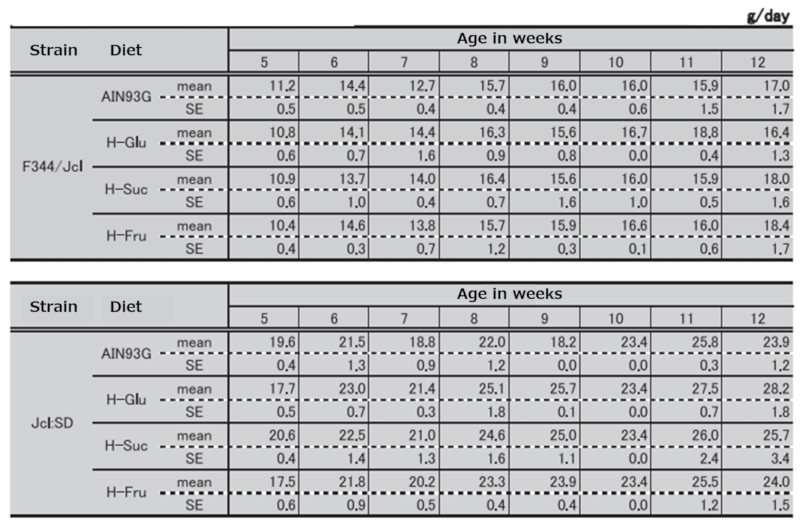
2.Food intake
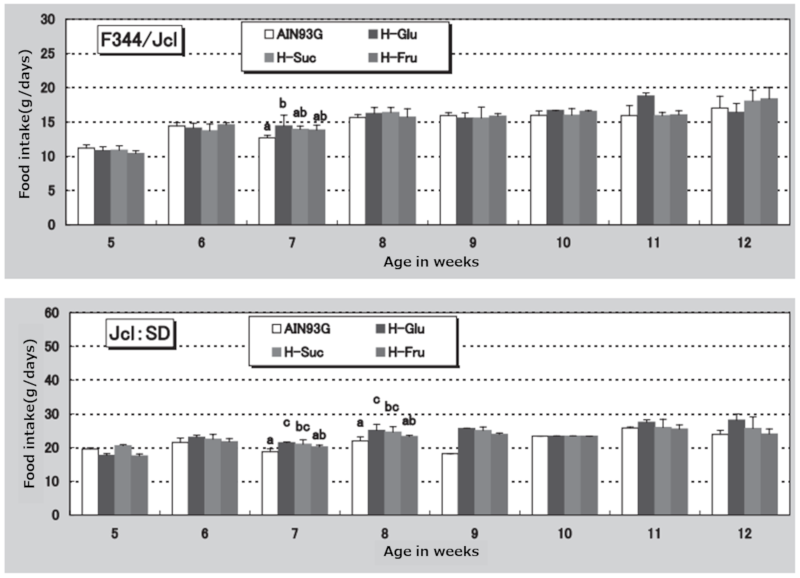
Figure 1. Changes in food intake over time.
The bars and vertical lines represent the mean ± standard error of the mean. Statistical analysis was performed between groups at the same age, and different letters indicate significant differences (p < 0.05).
Table 3. Changes in food intake in rats of each strain.
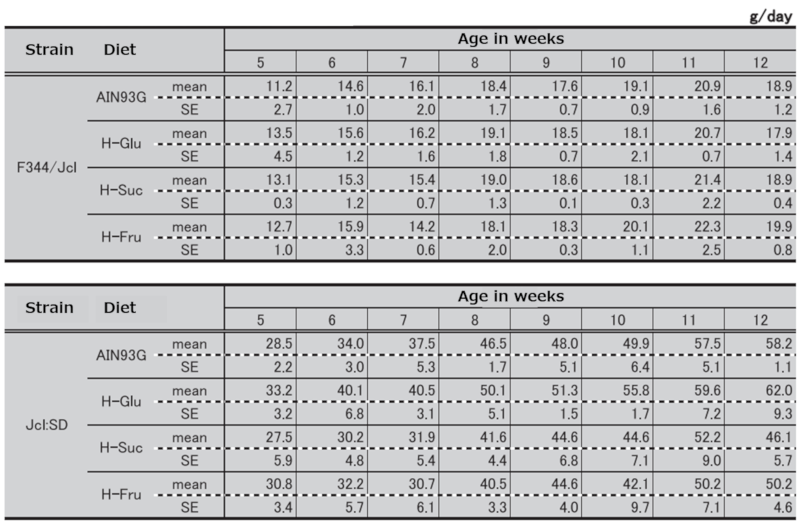
3.Water intake
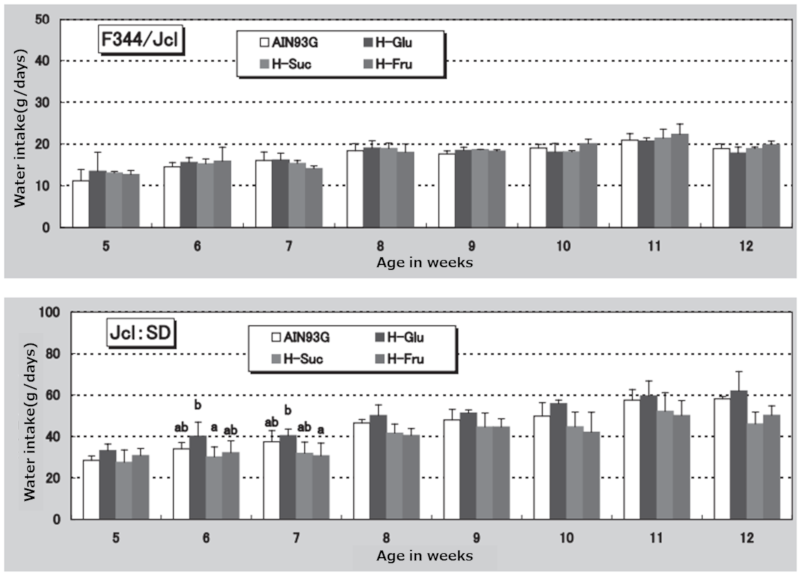
Figure 2. Changes in water intake over time.
The bars and vertical lines in the figure represent the mean ± standard error. Statistical analyses were conducted between groups of the same age, and different letters above the bars indicate significant differences (p < 0.05).
Table 4. Changes in water intake in rats of each strain.
4.Body weight
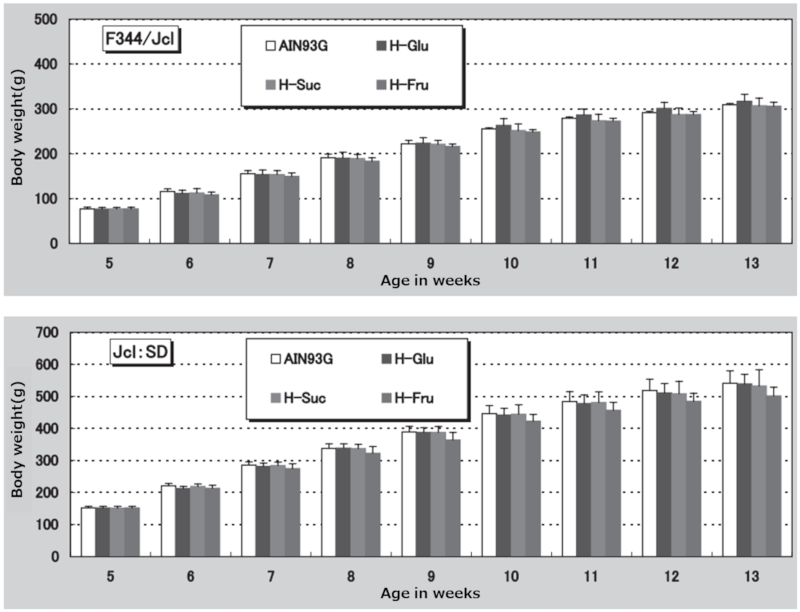
Figure 3. Body weight.
Body weight was measured weekly. The bars and vertical lines represent the mean ± standard error of the mean.
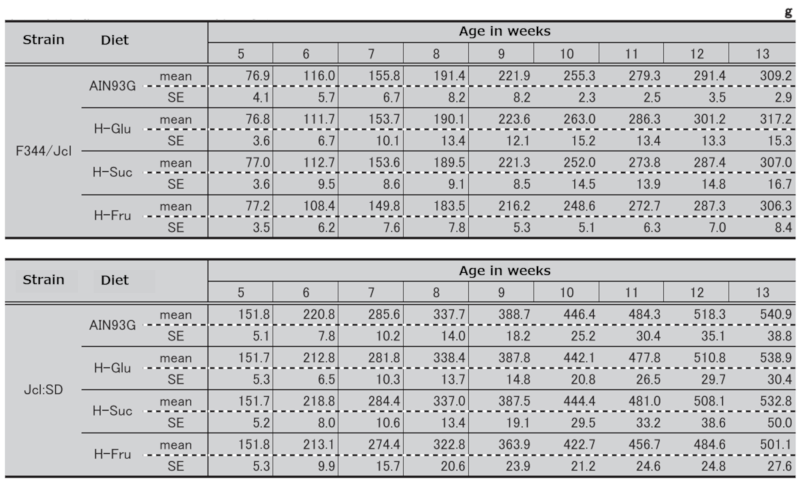
Table 5. Changes in body weight in rats of each strain.
5.Results of oral glucose tolerance test
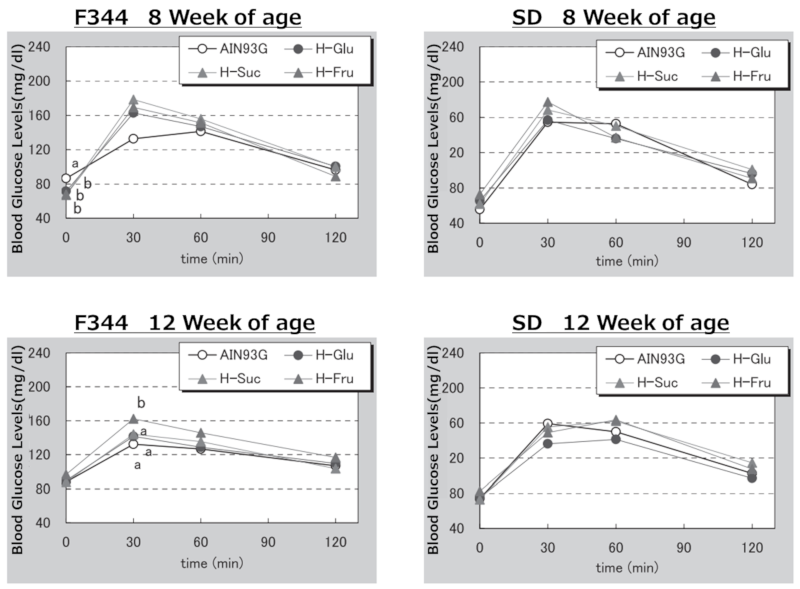
Figure 4. Results of oral glucose tolerance test.
Oral glucose tolerance tests were performed at 8 and 12 weeks of age. After a 15-hour fast, glucose was administered orally (2 g/kg body weight), and blood glucose levels were measured at 30, 60, and 120 minutes after administration. Statistical analysis was performed between groups at each time point, and different letters indicate significant differences (p < 0.05).
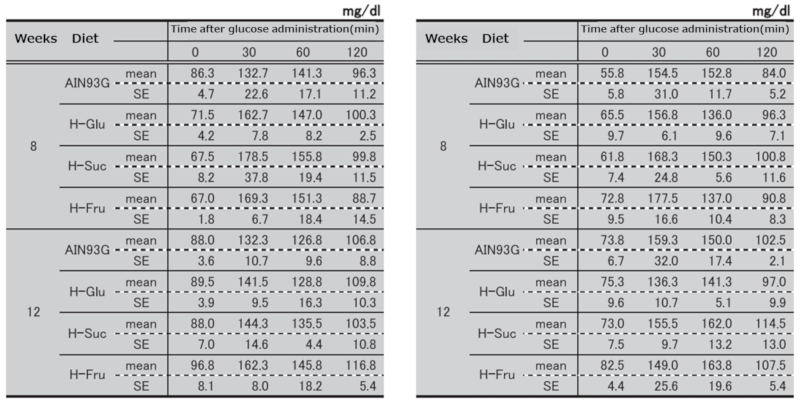
Table 6. Results of oral glucose tolerance test in F344 rats at each age.
Table 7. Results of oral glucose tolerance tests in SD rats at each age.
Table 6. Table 7.
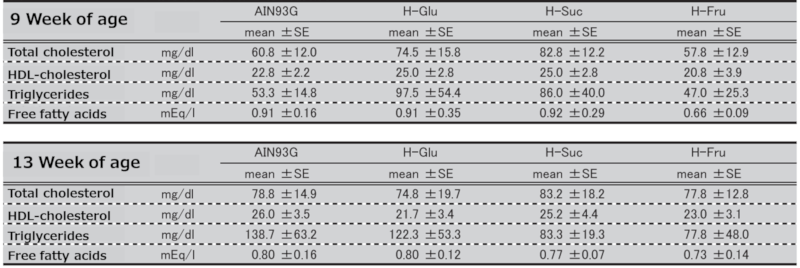
6.Concentrations of blood lipids and related substances
Table 8. Concentrations of blood lipids and related substances in F344 rats.
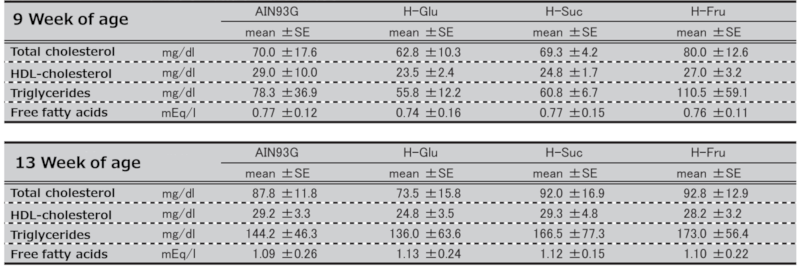
Table 9. Concentrations of blood lipids and related substances in SD rats.
7.Relative organ weight
Table 10. Body weight and relative organ weights in F344 rats.
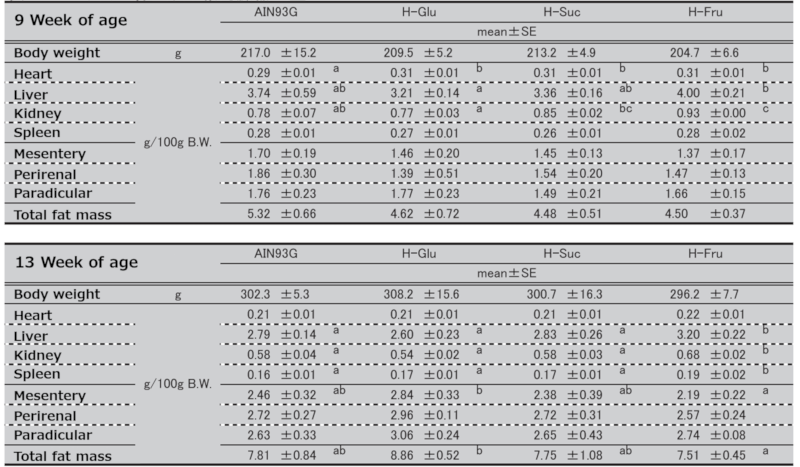
Significant differences were observed between groups indicated by different letters (p < 0.05).
Table 11. Body weight and relative organ weights in SD rats.
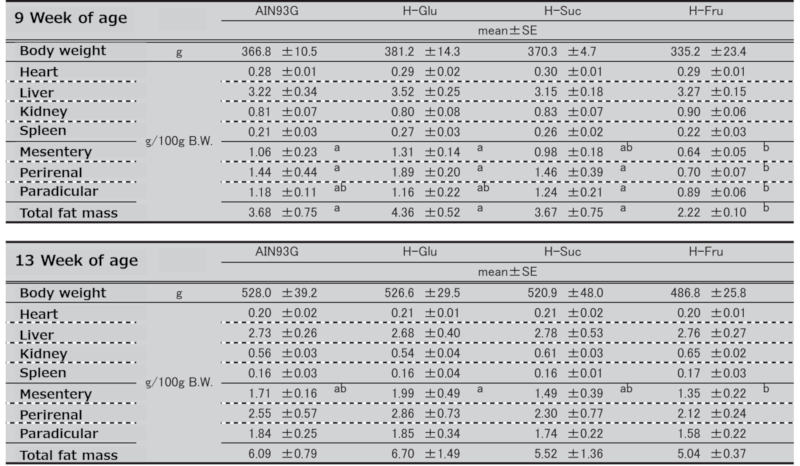
Significant differences were observed between groups indicated by different letters (p < 0.05).
8.Hepatic triglyceride content and liver histology
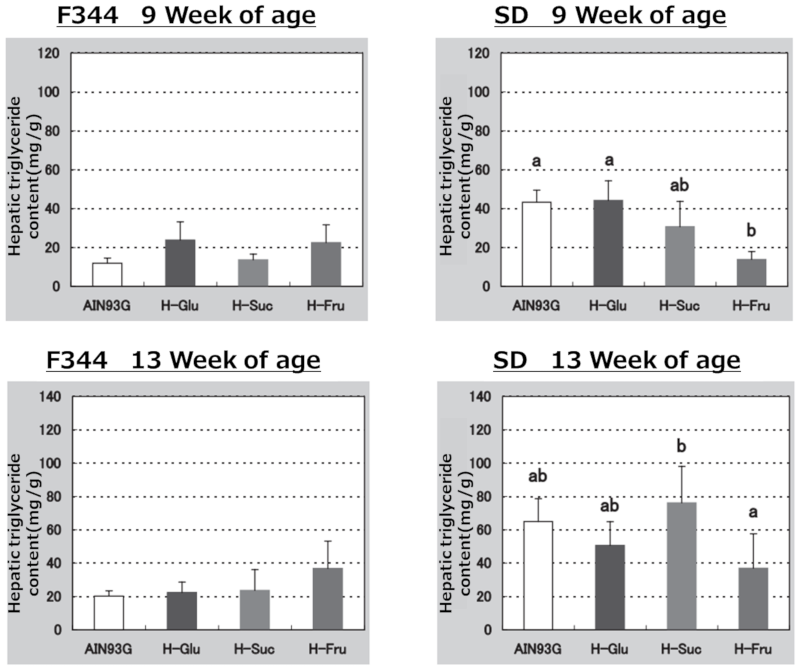
Figure 5. Hepatic triglyceride content at the time of sacrifice.
Hepatic triglyceride content was measured in liver samples collected at 9 and 13 weeks of age. Bars and vertical lines in the figure represent the mean ± standard error. Different letters indicate significant differences between groups (p < 0.05).
Table 12. Hepatic triglyceride content in rats of each strain.
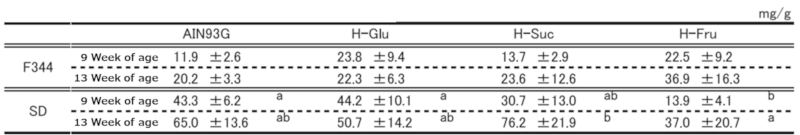
Significant differences were observed between groups indicated by different letters (p < 0.05).
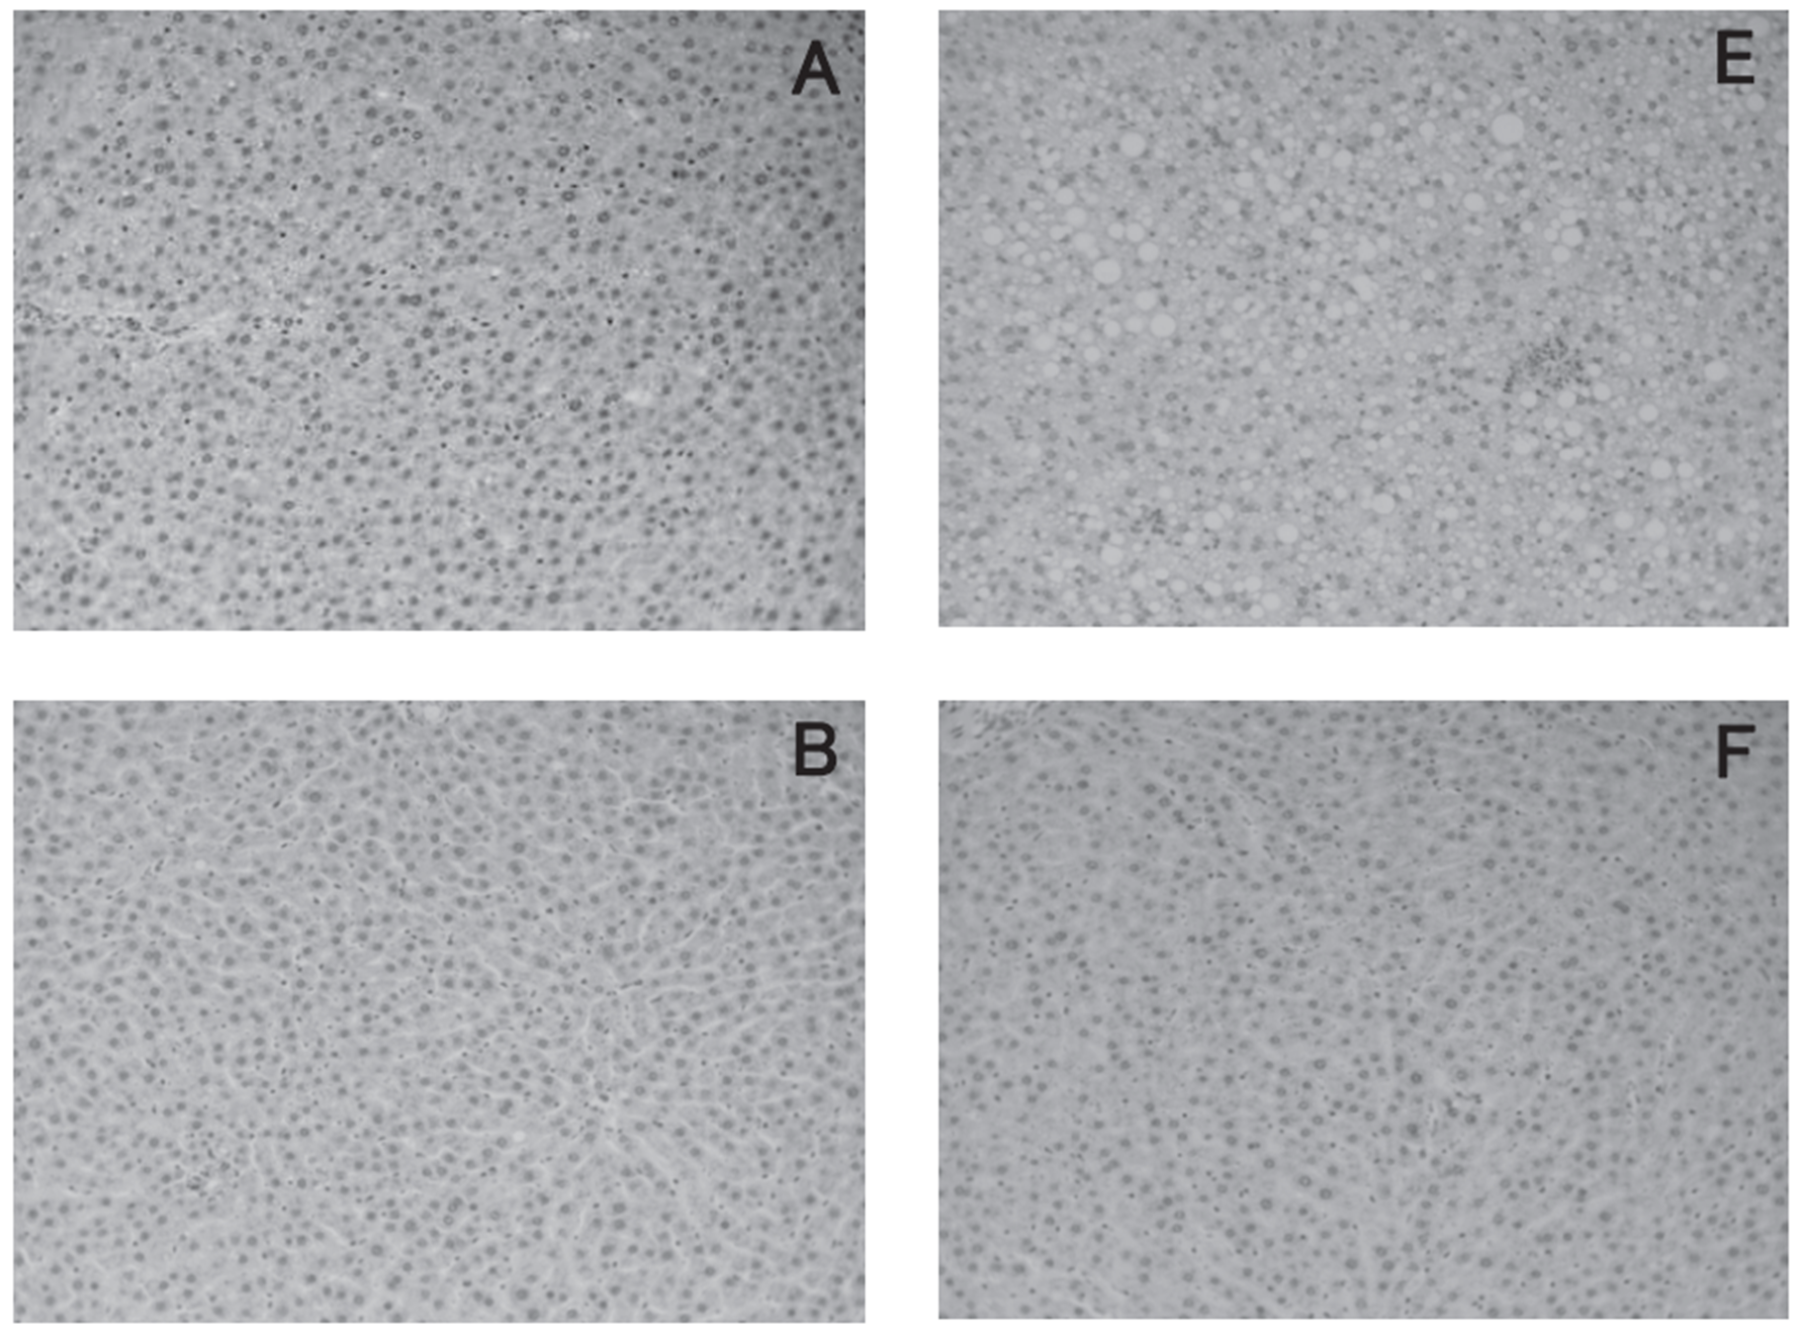
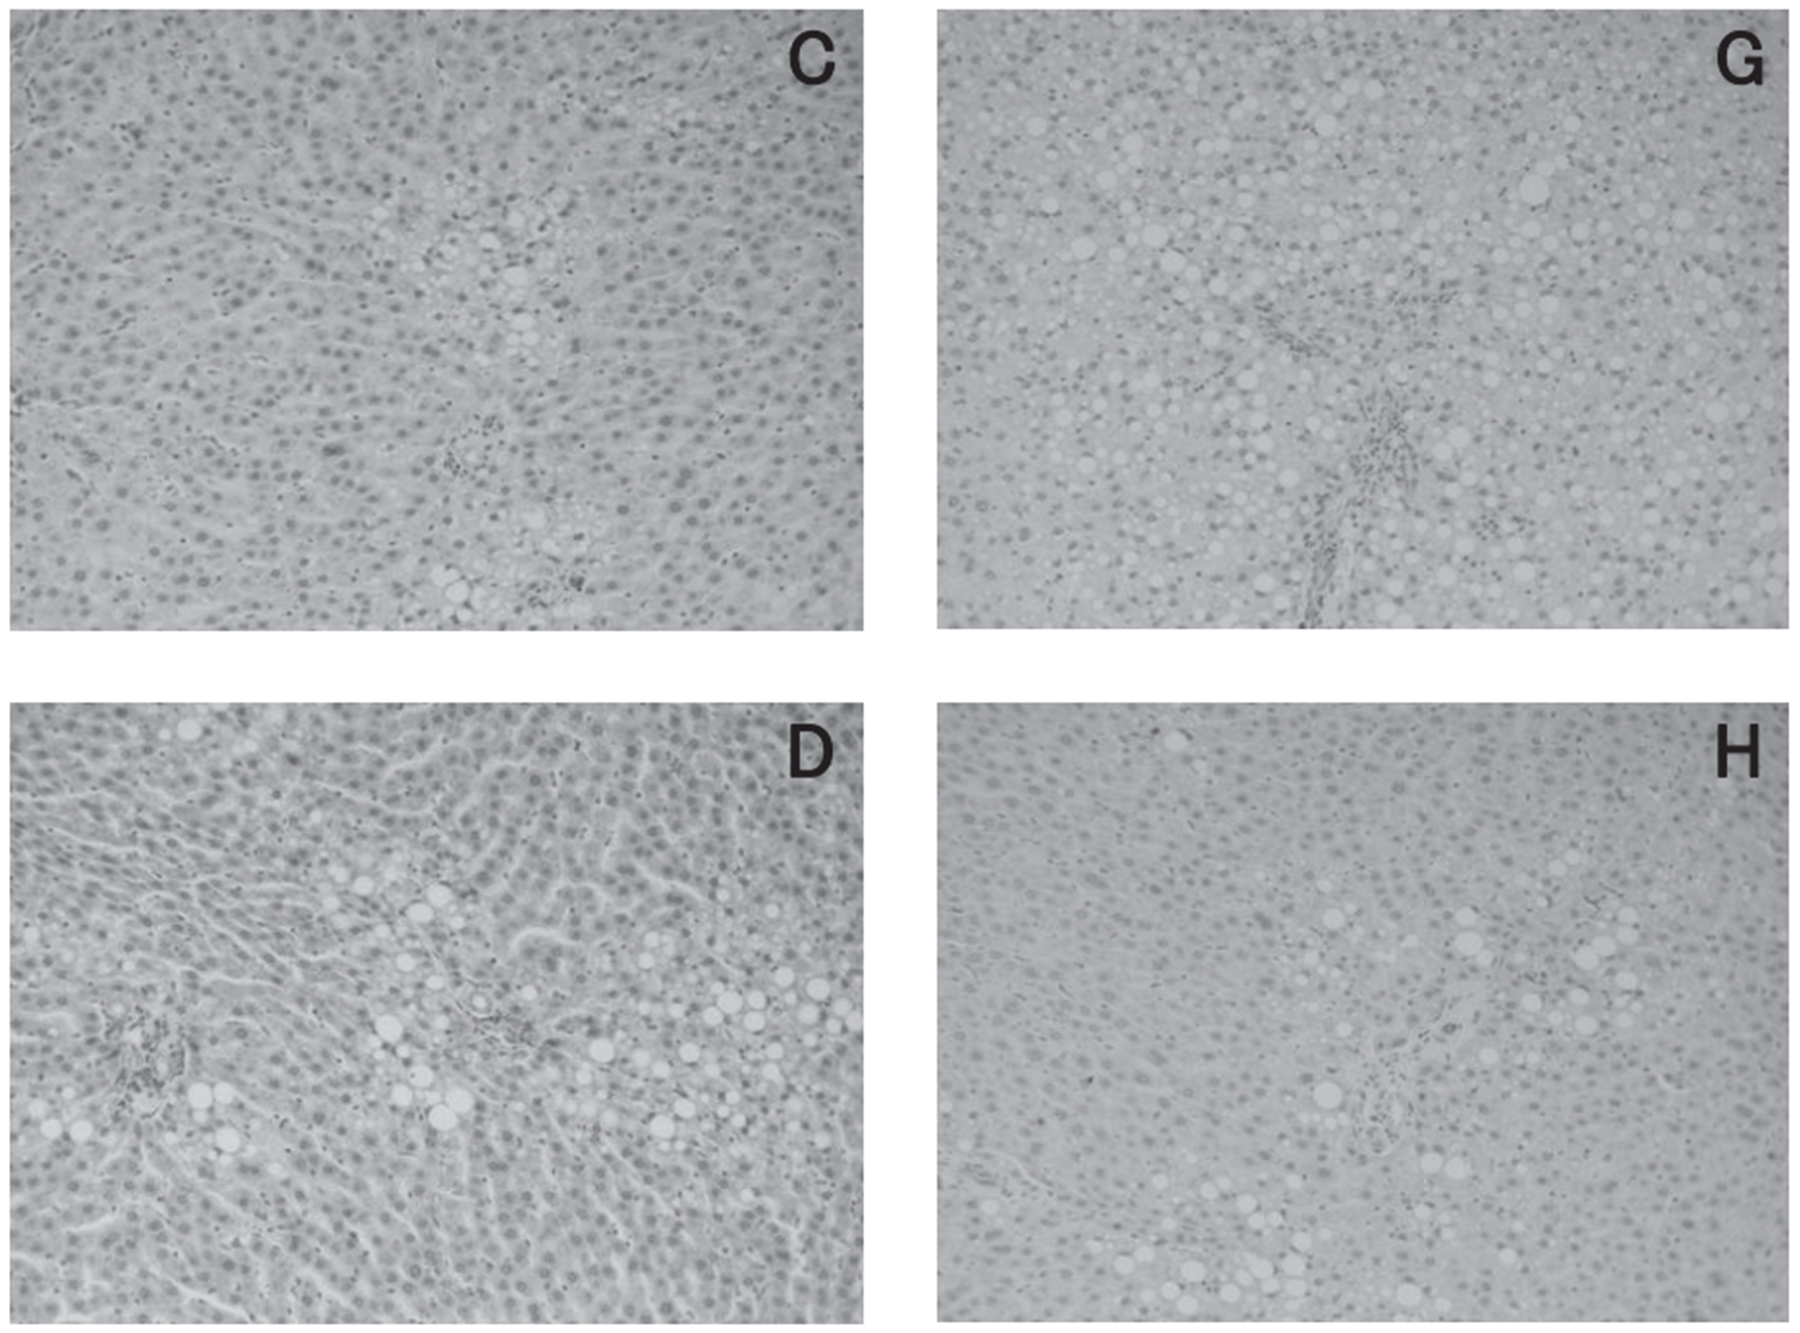
Figure 6. Liver histology at 13 weeks of age (x100).
(A-D) F344/Jcl rats; (E-H) Jcl:SD rats.
A: AIN93G group, B: H-Glu group, C: H-Suc group, D: H-Fru group, E: AIN93G group, F: H-Glu group, G: H-Suc group, H: H-Fru group.