Diet Research Data:Effects of Quick Fat Diet on Female C57BL/6J Mice
3.Fasting Blood Glucose Levels
7.Major Organ Weights at Biopsy
8.Photographs of Liver and Peritoneal Adipose Tissue
Related CLEA Japan product: Quick Fat
For the animal, please click here↓![]() : https://www.clea-japan.com/en/products/general_diet/item_d0070
: https://www.clea-japan.com/en/products/general_diet/item_d0070
Inquiry:
If you have any question, please feel free to contact us from here.
1.Objective
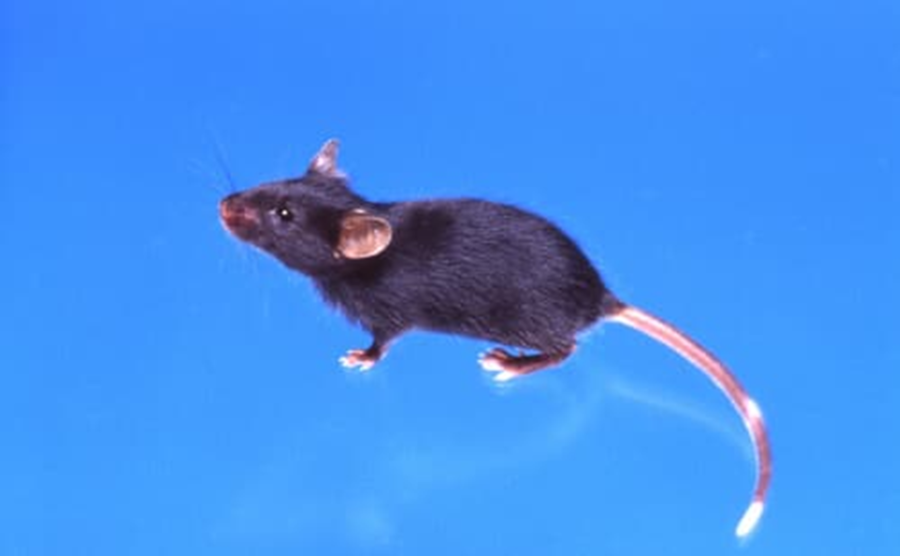
This study examined the effects of a high-fat diet (Quick Fat; QF) on female C57BL/6J mice.
2.Materials and Methods
(1)Experimental Site
The experiment was conducted in the animal facility of Japan Veterinary and Animal Sciences University (currently Japan Veterinary and Life Science University).
(2)Diet
- CE-2: Crude fat content 4.6%, Fat kcal% 11.9%, Soluble non-nitrogenous substance content 51.4%, NFE kcal% 59.3%
- Quick Fat (QF): Crude fat content 13.6%, Fat kcal% 29.8%, Soluble non-nitrogenous substance content 47.8%, NFE kcal% 46.6%
(3)Animals
Female C57BL/6JJcl mice were used as subjects (10 mice per group, 20 mice in total).
(4)Housing
- Temperature and humidity: Temperature = 21-25°C, Humidity = 40-60%
- Lighting: 14 hours of light, 10 hours of dark (lights on 6:00-20:00)
- Cages: Individually housed in polycarbonate cages with sterilized wood chips
- Diet: Ad libitum
- Drinking water: Ad libitum
(5)Experimental Procedure
Female C57BL/6J mice were introduced at 4 weeks of age and acclimatized for 1 week (fed CE-2). The mice were then divided into two groups based on body weight, blood glucose levels, and blood glucose levels during an oral glucose tolerance test at 5 weeks of age. The experimental diet was fed from 5 weeks of age to 20 weeks of age. After a 20-hour fast at the end of the feeding trial, the mice were euthanized under ether anesthesia, and blood was collected from the posterior vena cava. Major organs (heart, liver, kidney, spleen, ovary) and adipose tissue were removed and weighed. The obtained blood was centrifuged, and serum and plasma were stored for the measurement of total cholesterol, free fatty acids, triglycerides, and HDL cholesterol. Student's t-test was used for statistical analysis.
3.Results
The results are described below.
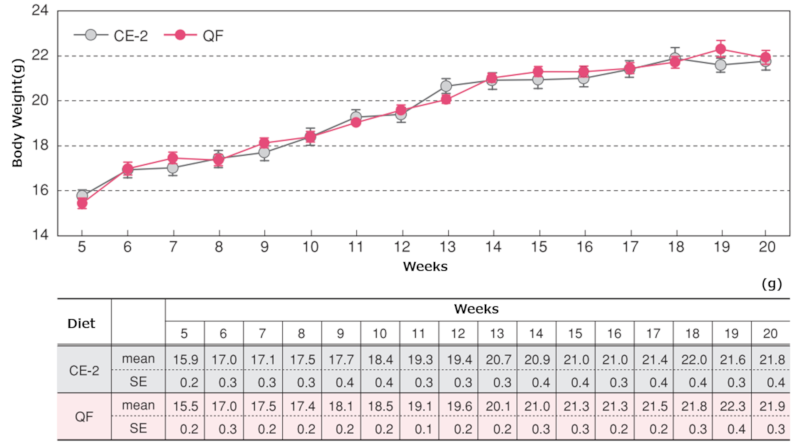
1.Body Weight
Body Weight Changes
Body weight was measured weekly. The points and vertical lines in the figure represent the mean ± standard error. Statistical analysis was performed between groups at each age, and * indicates a significant difference (p < 0.05).
2.Food and Water Intake
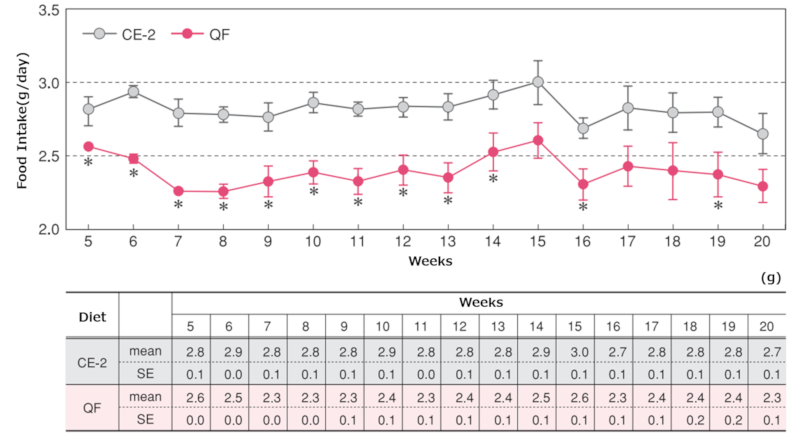
Food Intake
Food intake represents the average daily intake per mouse at each age. The points and vertical lines in the figure represent the mean ± standard error. Statistical analysis was performed between groups at each age, and * indicates a significant difference (p < 0.05).
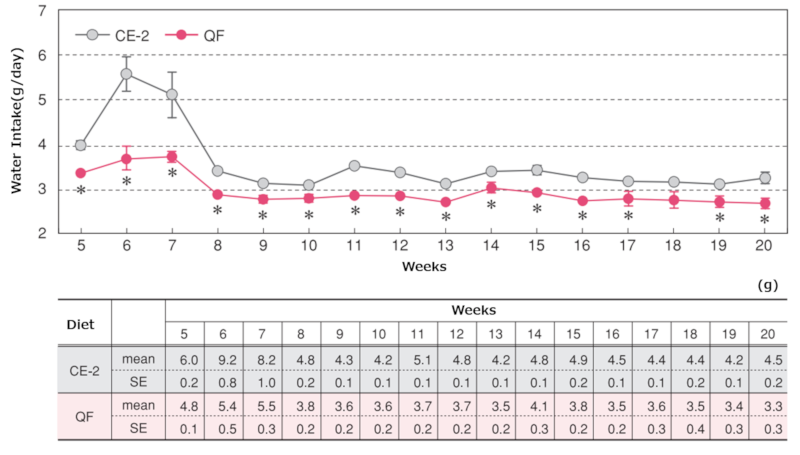
Water Intake
The points and vertical lines in the figure represent the mean ± standard error. Statistical analysis was performed between groups at each age, and * indicates a significant difference (p < 0.05). Water intake represents the average daily intake per mouse at each age.
3.Fasting Blood Glucose Levels
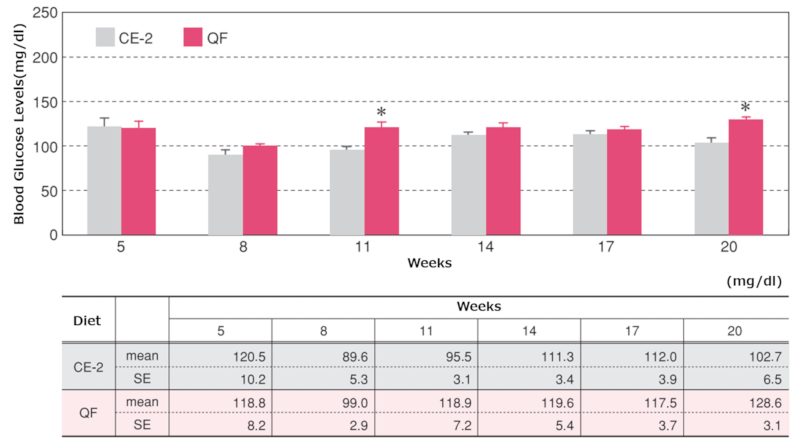
Changes in Fasting Blood Glucose Levels
Blood samples were collected from the tail vein every 3 weeks at 1 pm, 4 hours after lights on. Whole blood was measured using a whole blood glucose meter (Glucotest PROR / Sanwa Kagaku Kenkyusho Co., Ltd.). The vertical bars and lines in the figure represent the mean ± standard error. Statistical analysis was performed between groups at each age, and * indicates a significant difference (p < 0.05).
4.Oral Glucose Tolerance Test
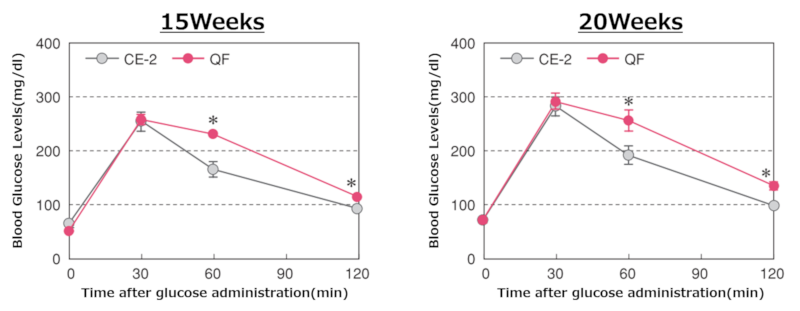
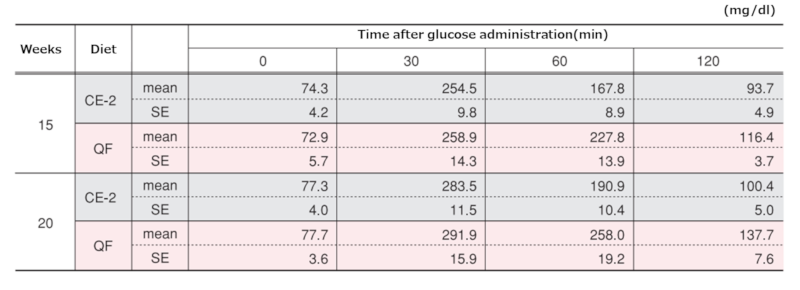
Results of Oral Glucose Tolerance Test at Each Age
The points and vertical lines in the figure represent the mean ± standard error. The tests were conducted at 15 and 20 weeks of age (before starting the experimental diet, 10 weeks, and 15 weeks). After an overnight fast (20 hours), a glucose solution (2g/kg body weight) was orally administered via gastric gavage, and blood was collected from the tail vein before administration (0 min) and 30, 60, and 120 min after administration. Whole blood was measured using a whole blood glucose meter (Glucotest PROR / Sanwa Kagaku Kenkyusho Co., Ltd.). Statistical analysis was performed between groups at each time point, and * indicates a significant difference (p < 0.05).
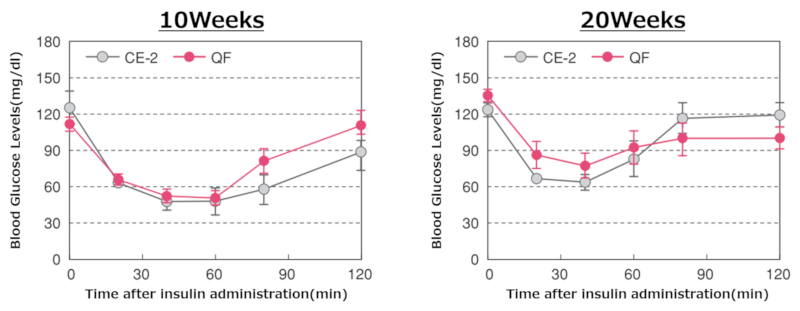
5.Insulin Tolerance Test
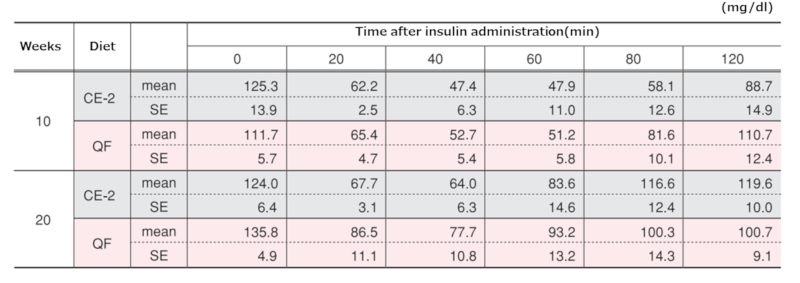
Changes in Results of Insulin Tolerance Test at Each Age
The tests were conducted at 10 and 20 weeks of age (5 and 15 weeks after starting the experimental diet). An insulin solution (0.5 IU/kg body weight) was intraperitoneally injected, and blood was collected from the tail vein before administration (0 min) and 20, 40, 60, 80, and 120 min after administration. Whole blood glucose levels were measured using a whole blood glucose meter (Glucotest PROR / Sanwa Kagaku Kenkyusho Co., Ltd.). The points and vertical lines in the figure represent the mean ± standard error.
6.Blood Analysis at Biopsy
Blood Lipid Analysis
At 20 weeks of age, blood was collected from the posterior vena cava after a 20-hour fast under ether anesthesia. Serum levels of total cholesterol (T-Cho), HDL-cholesterol (HDL-Cho), triglycerides (TG), and non-esterified fatty acids (NEFA) were analyzed. The vertical bars and lines in the figure represent the mean ± standard error.


7.Major Organ Weights at Biopsy
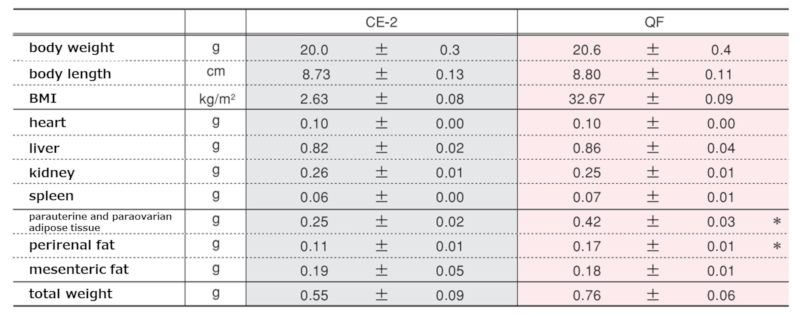
Major Organ Weights
At 20 weeks of age, animals were sacrificed after a 20-hour fast under ether anesthesia, and the weights of various organs were measured. The vertical bars and lines in the figure represent the mean ± standard error. Statistical analysis was performed between groups for each item, and * indicates a significant difference (p < 0.05).

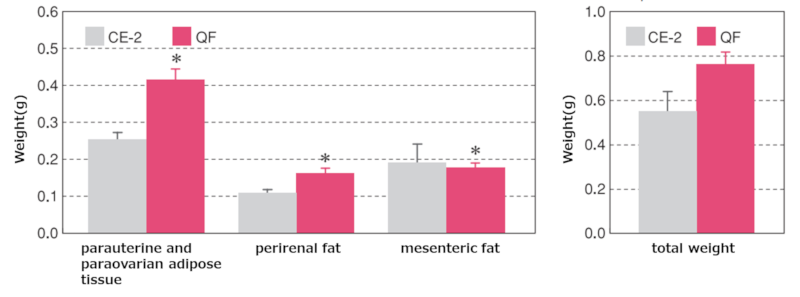
Adipose Tissue Weights
At 20 weeks of age, animals were sacrificed after a 20-hour fast under ether anesthesia, and the weights of adipose tissues were measured. The vertical bars and lines in the figure represent the mean ± standard error. Statistical analysis was performed between groups for each item, and * indicates a significant difference (p < 0.05).
Major Organ and Adipose Tissue Weights
The values in the table represent the mean ± standard error. Statistical analysis was performed between groups for each item, and * indicates a significant difference (p < 0.05).
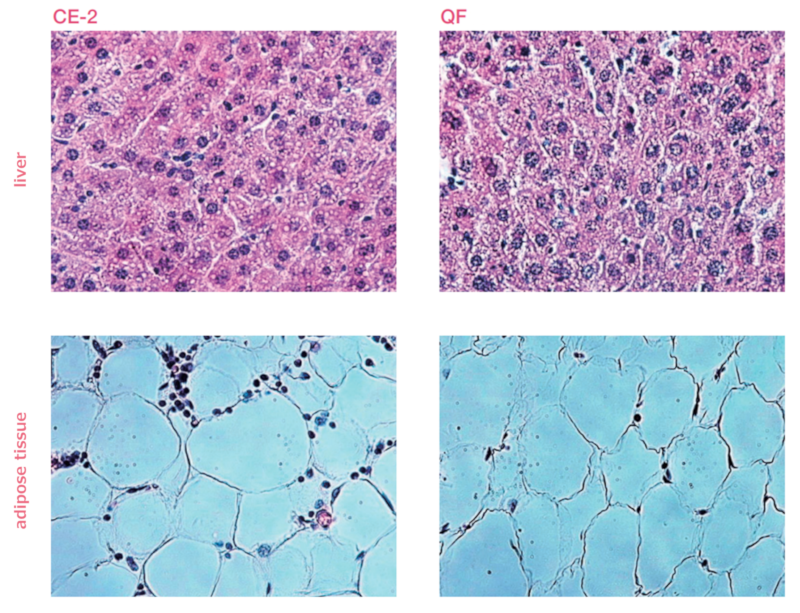
8.Photographs of Liver and Peritoneal Adipose Tissue
Tissue Photographs at 20 Weeks of Age (Liver, Adipose Tissue; HE staining, ×400)
The upper panel shows the liver, and the lower panel shows the adipose tissue.
