Objective
As part of a development study, we evaluated the effects of feeding a high-fat diet to Jcl:SD rats by comparing obesity and liver and kidney function with those in a normal diet feeding group.
Materials
Animals:Male and female Jcl:SD (SPF) rats, 4 weeks of age, were used in the study. Each group consisted of 5 males and females.
Dietary Feed:
- CE-2 (High-pressure steam sterilized)
- Quick Fat (QF) (Radiation sterilized)
Housing Conditions:
- Temperature: 20–26°C, Humidity: 45–70%
- Light cycle: 12 hr light / 12 hr dark
- Housed individually in bracket cages
- Diet: Ad libitum feeding
- Water: Sterilized water ad libitum
Method
Four-week-age Jcl:SD rats (hereafter referred to as SD rats) were assigned to two groups—the CE-2 group and the QF group—so that there were no differences in body weight between groups. The animals were fed their respective diets from 4 to 24 weeks of age.During the feeding period, food intake and water consumption were measured weekly. Body weight was measured every two weeks, and blood glucose levels were measured every four weeks using a portable blood glucose meter (Glutest Mint II; Sanwa Kagaku Kenkyusho Co., Ltd.).
At 24 weeks of age, the animals were euthanized under isoflurane anesthesia and subjected to biopsy. Organs were collected and blood samples were obtained. The collected blood samples were analyzed using an automatic biochemical analyzer (Auto Analyzer 3500; Hitachi High-Tech) to determine biochemical parameters, including blood glucose, total cholesterol, triglycerides, ALT, AST, BUN, and creatinine (Cre).
Insulin and glucagon levels were measured using ELISA kits.
In addition, urine samples were collected by bladder puncture at biopsy, and urinary protein and urinary creatinine levels were measured. Statistical analyses were performed using Student’s t-test, with significance levels set at P < 0.05 and P < 0.01.
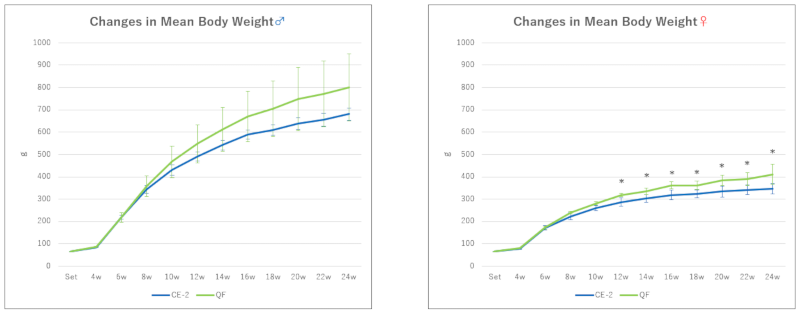
Changes in Mean Body Weight of SD Rats (Comparison between CE-2 and QF groups)
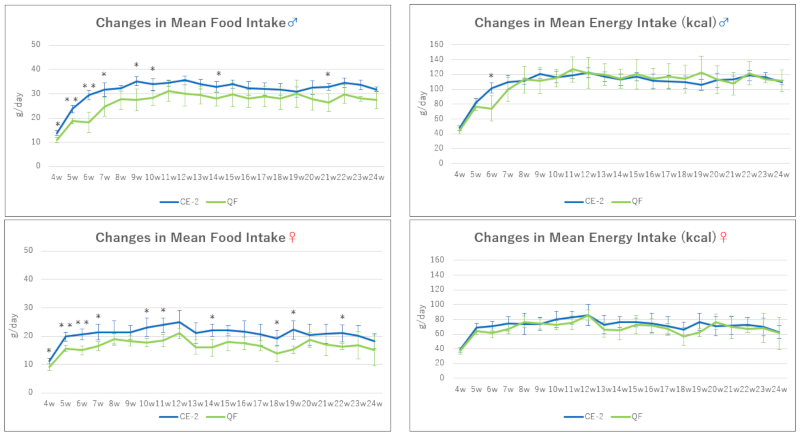
Mean Food Intake and Energy Intake (kcal) of SD Rats (Comparison between CE-2 and QF groups)
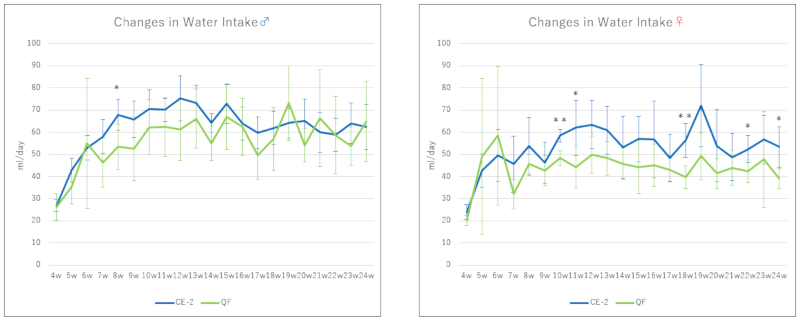
Changes in Mean Water Intake of SD Rats (Comparison between CE-2 and QF groups)
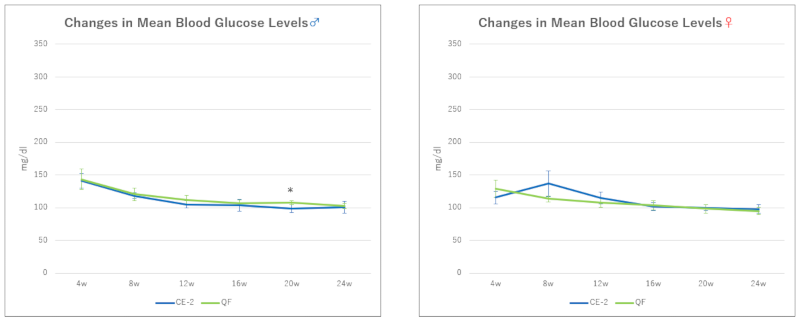
Changes in Mean Blood Glucose Levels of SD Rats (Comparison between CE-2 and QF groups)
Comparison of Organ Weights in SD Rats (CE-2 vs. QF groups: Liver and Kidney)

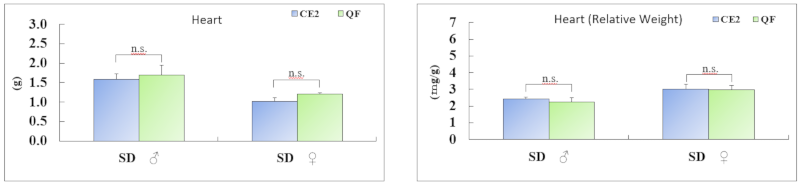
Comparison of Organ Weights in SD Rats (CE-2 vs. QF groups: Heart and White Adipose Tissue)
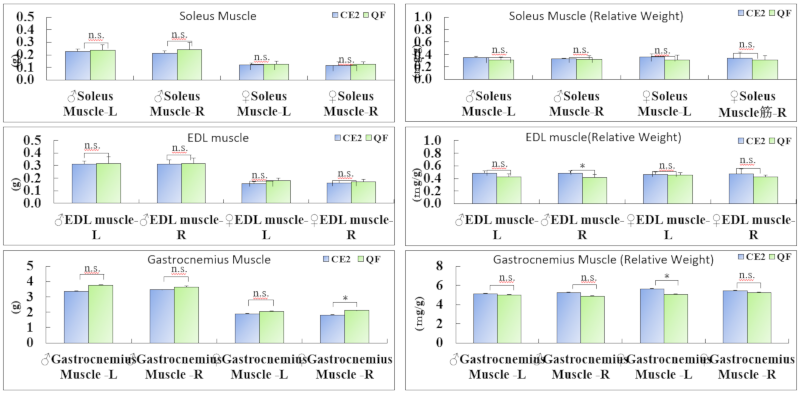
Comparison of Muscle Weights in SD Rats (CE-2 vs. QF groups)
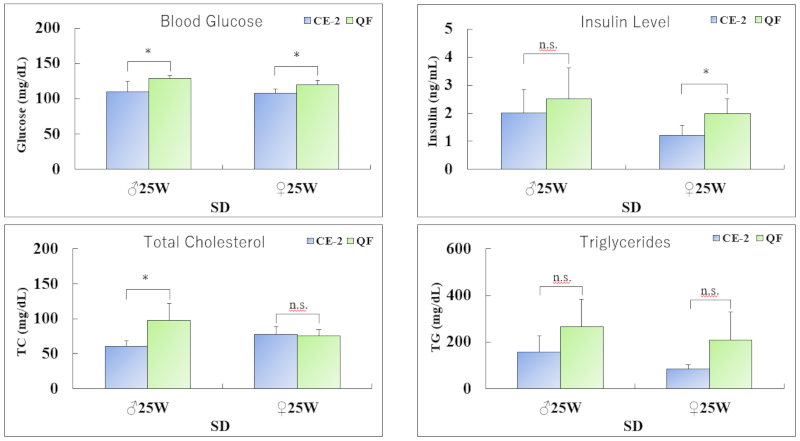
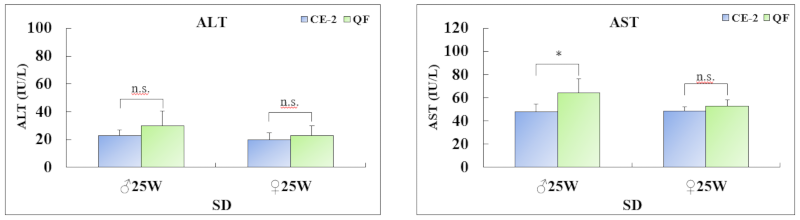
Blood Biochemical Parameters (1) Comparison between CE-2 and QF groups in SD rats
Blood Biochemical Parameters (2) Comparison between CE-2 and QF groups in SD rats
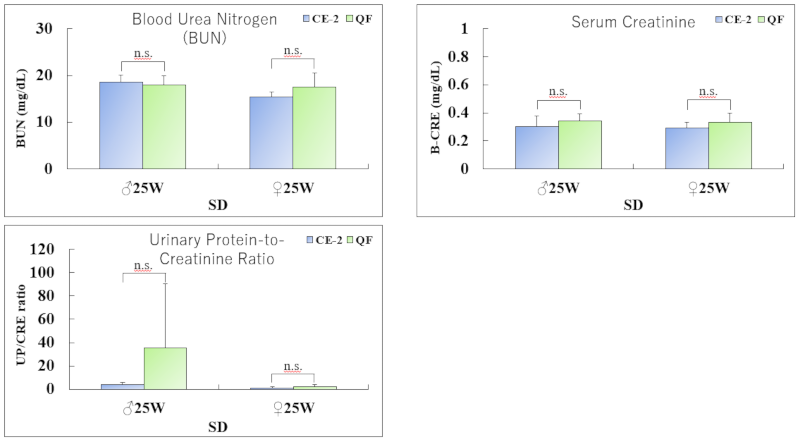
Blood Biochemical Parameters (3) Comparison between CE-2 and QF groups in SD rats
Summary
In SD rats fed the QF diet, male body weight tended to be higher than that of the CE-2 group from 10 weeks of age, reaching an average of approximately 800 g at 24 weeks of age. This exceeds the criteria for a diet-induced obesity (DIO) model in rats (i.e., an increase of 15–25% or more compared with standard diet controls of the same age), indicating a high sensitivity to DIO in males.In contrast, female rats showed significantly higher body weights than the CE-2 group from 12 to 24 weeks of age; however, the degree of weight gain was modest, remaining at approximately 400 g.
Furthermore, at 25 weeks of age, males exhibited significantly elevated liver enzyme levels (AST) and lipid parameters (total cholesterol), with a tendency toward increased triglyceride levels. Based on these findings, further pathological and histological investigations, including evaluation for fatty liver, are planned.
Inquiry
Please feel free to contact us using the form below. A sales representative will get in touch with you.