Diet Research Data:Long-term Feeding Study of AIN-93G and CLEA Purified Diets in C57BL/6J Jcl Mice
1.Objectives, Materials and Methods
2.Analytical Results of Experimental Diets
3.Experimental Results
①.Feed Intake
②.Water Intake
③.Body Weight
④.Organ Weight
⑤.Blood Biochemical Parameters
Related CLEA Japan product: CE-2

For the animal, please click here↓![]() : https://www.clea-japan.com/en/products/general_diet/item_d0030
: https://www.clea-japan.com/en/products/general_diet/item_d0030
Related CLEA Japan product: AIN-93G

For the animal, please click here↓![]() : https://www.clea-japan.com/en/products/special_diet/item_d0220
: https://www.clea-japan.com/en/products/special_diet/item_d0220
Inquiry:
If you have any question, please feel free to contact us from here.
1.Objectives
To collect basic background data for special diets for mice and rats, and to collect long-term feeding data for AIN-93G and CLEA purified basal diets.
2.Materials and Methods
(1)Experimental animals
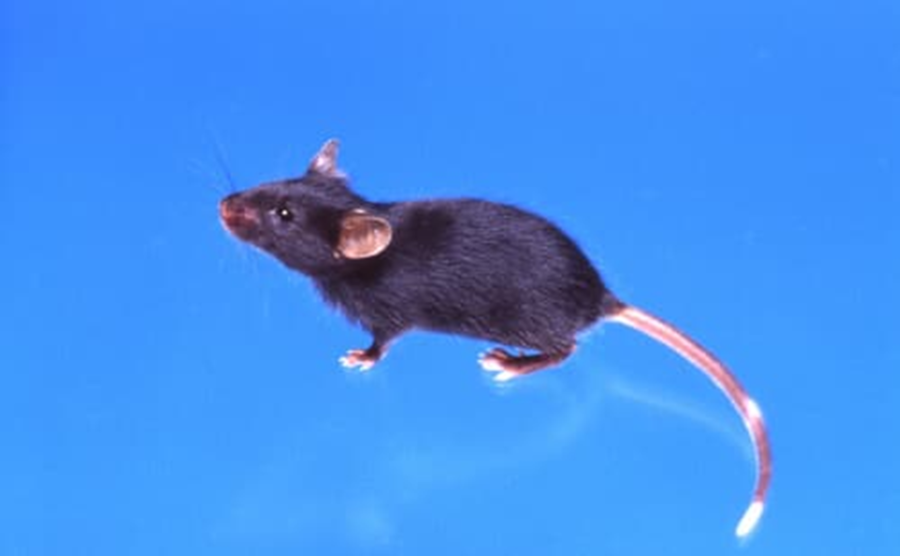
480 C57BL/6JJcl mice (240 males, 240 females)
(2)Diets
CE-2 (control), AIN-93G, CLEA purified basal diet (CLEA)
(3)Experimental design
Mice were introduced at 4 weeks of age and acclimated for 1 week (fed CE-2). After that, 80 mice of each sex were divided into 3 groups so that there were no differences in body weight and fed each diet started from 5 weeks of age. The experiment was conducted in the mouse and rat breeding room (conventional, temperature: 23 ± 2°C, humidity: 40-60%, 12-hour light-dark cycle (light: 9:00-21:00)) of Nippon Compound Feed Manufacturing Co., Ltd. Central Research Laboratory. Mice were housed 5 per polycarbonate cage (182 × 260 × 128 mm). Feed and drinking water (tap water) were provided ad libitum.
(4)Measurement items
- General condition: Daily
- Feed/water intake: Weekly feed and water intake were measured, and the daily average was calculated. However, measurements were taken every other week from 17 weeks of age.
- Body weight: Measured weekly. However, measurements were taken every other week from 17 weeks of age.
- Organ weight: At 4, 12, 24 and 48 weeks after the start of feeding (9, 17, 29 and 53 weeks of age, respectively), 20 animals (4 cages) from each group were fasted for 24 hours and then sacrificed under sevoflurane (Sevoflurane, Maruishi Pharmaceutical Co., Ltd.) anesthesia. After blood was collected from the abdominal aorta, each organ was collected. The organs measured were heart, liver, kidney, and spleen.
- Blood biochemical values: The collected blood was centrifuged to separate serum and plasma, stored at -80°C, and sent to CLEA Japan Fujinomiya Technical Service Center (FTSC) the following week for analysis of blood biochemical values.
(Measurement items: ALT, AST, ALP, Glu, T.C, T.P, Ca, CI, BUN, CRE)
3.Statistical analysis
- Multiple comparison tests using the Tukey-Kramer method were performed, and significant differences between groups at the 5% level are indicated by different signs.
Table 1. General Compositional Analysis of Experimental Diets
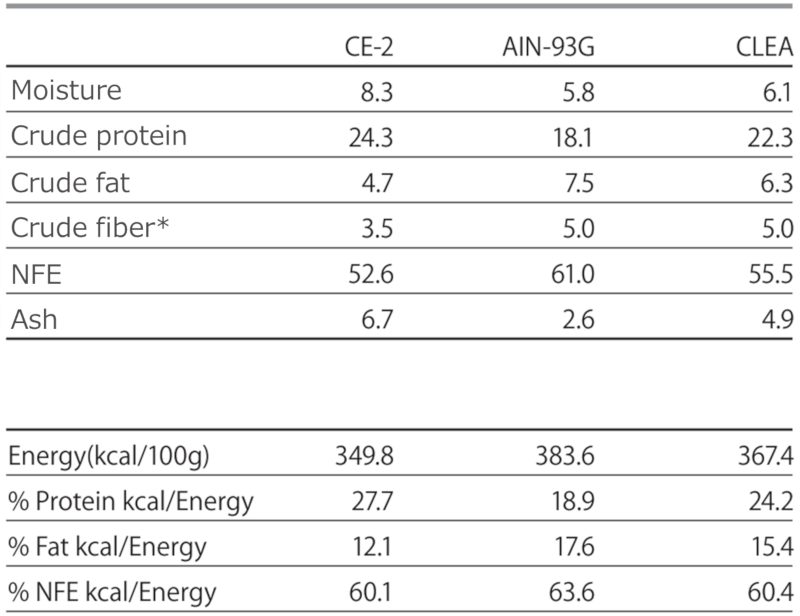
*For AIN-93G and CLEA diets, crude fiber was calculated based on the formulated value due to the difficulty of analysis using official methods.
①.Feed Intake
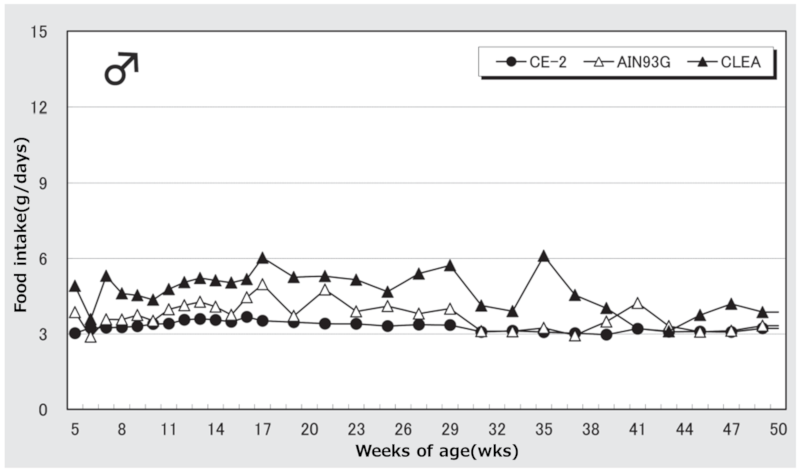
Figure 1. Changes in food intake over time in male mice.
Table 2. Changes in food intake over time in each group of male mice.
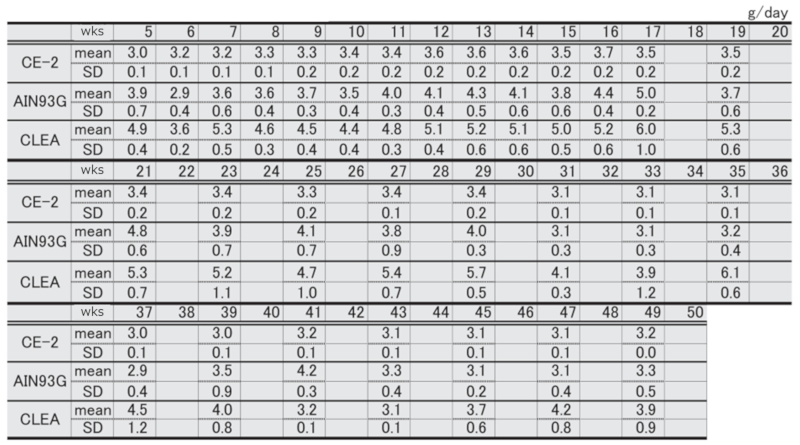
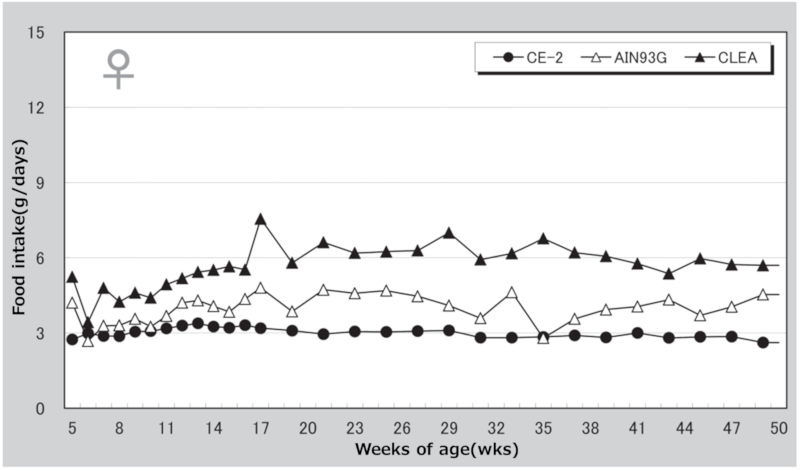
Figure 2. Changes in food intake over time in female mice.
Table 3. Changes in food intake over time in each group of female mice.
②.Water Intake
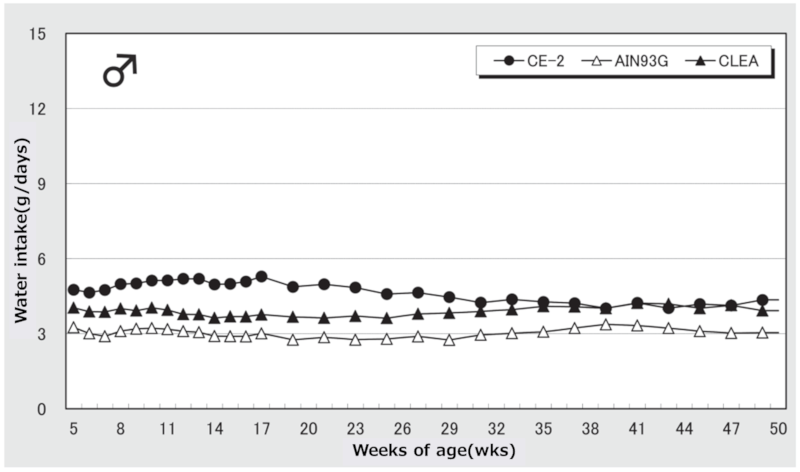
Figure 3. Changes in water intake over time in male mice.
Figure 4. Changes in water intake over time in female mice.
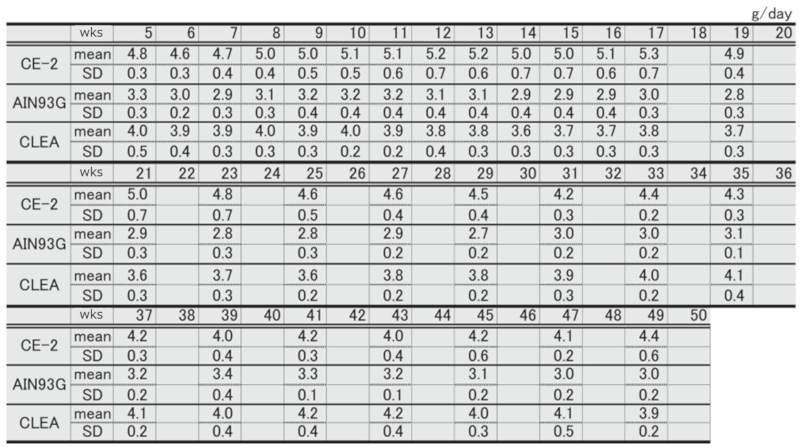
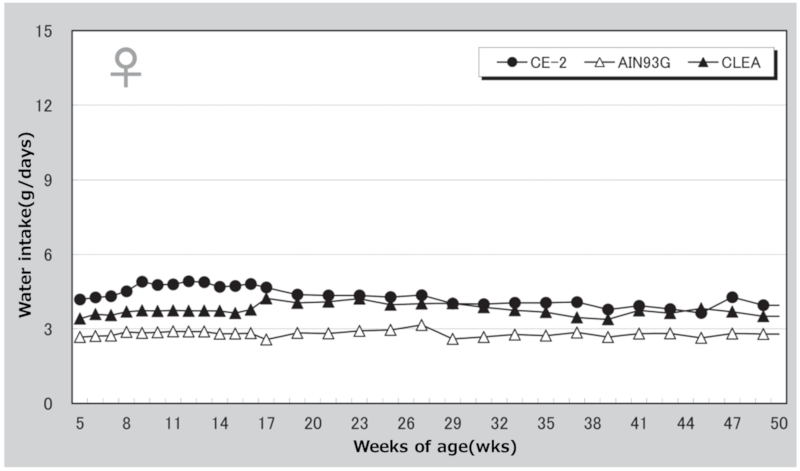
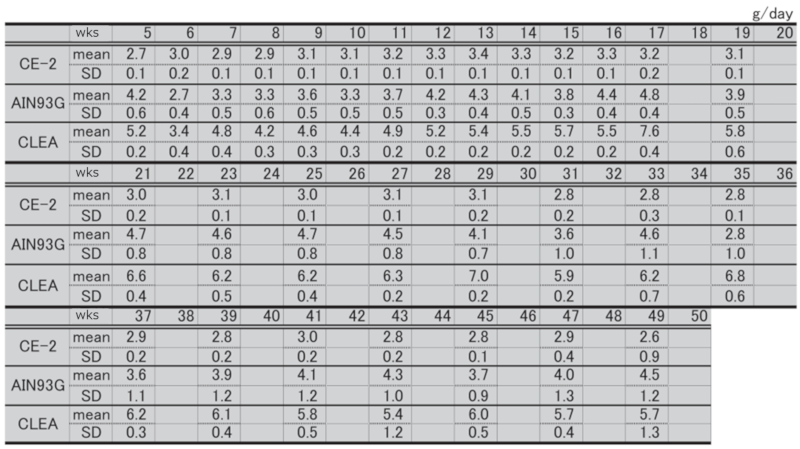
Table 4. Changes in water intake over time in each group of male mice.
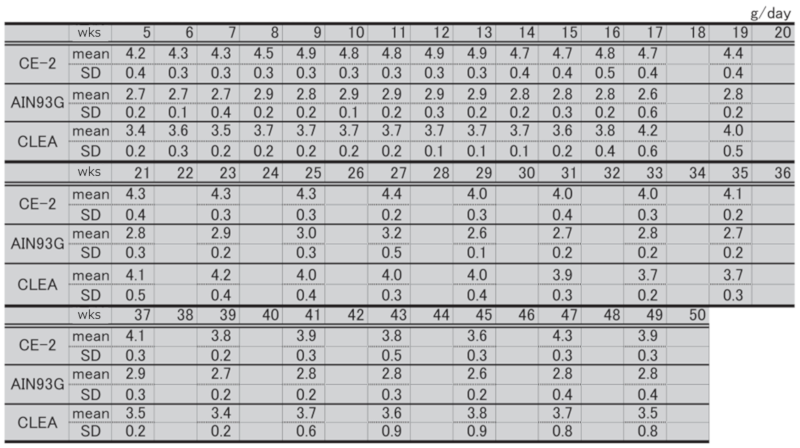
Table 5. Changes in water intake over time in each group of female mice.
③.Body Weight
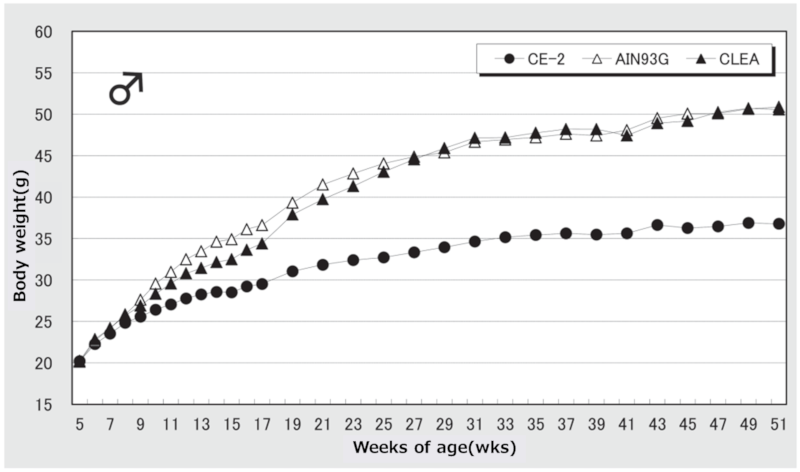
Figure 5. Changes in body weight over time in male mice.
Table 6. Changes in body weight over time in each group of male mice.
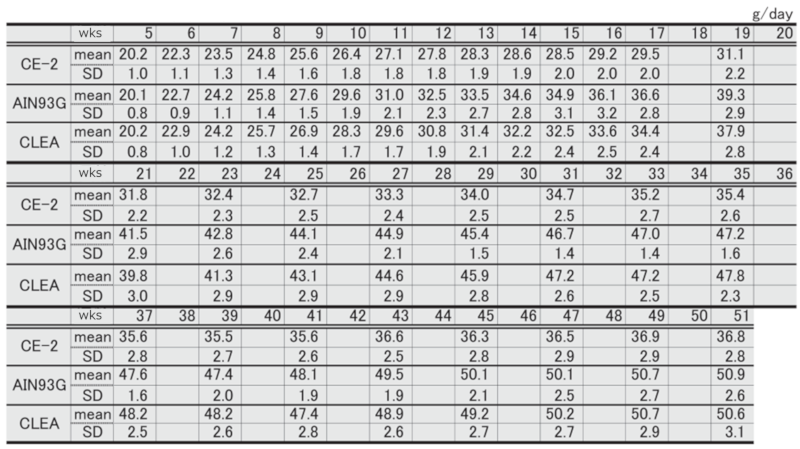
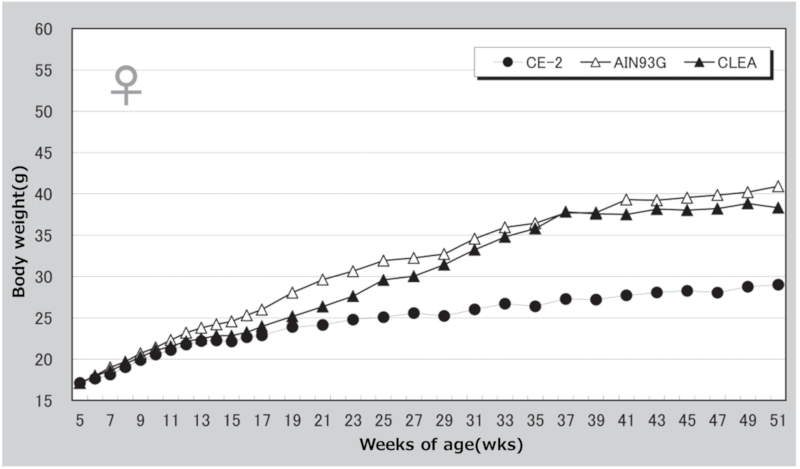
Figure 6. Changes in body weight over time in female mice.
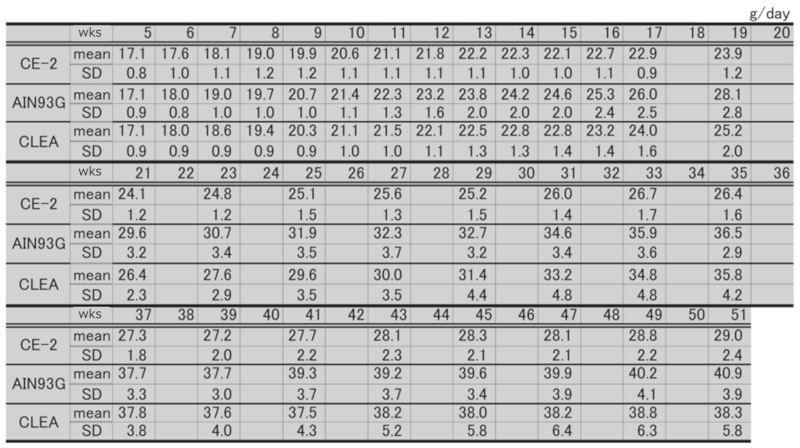
Table 7. Changes in body weight over time in each group of female mice.
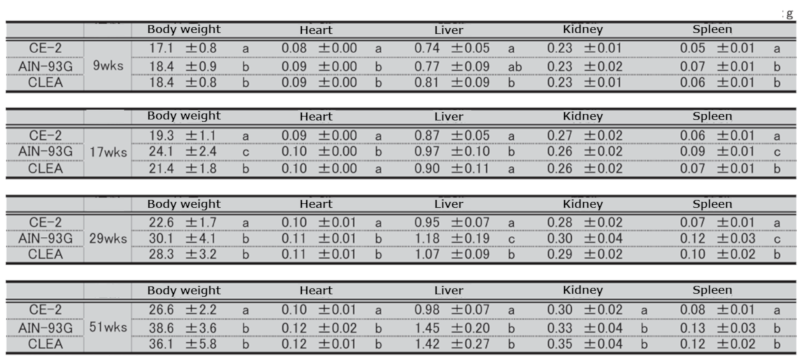
④.Organ Weight
Table 8. Organ weights at necropsy in male mice.
Significant differences are indicated by different signs (P < 0.05).
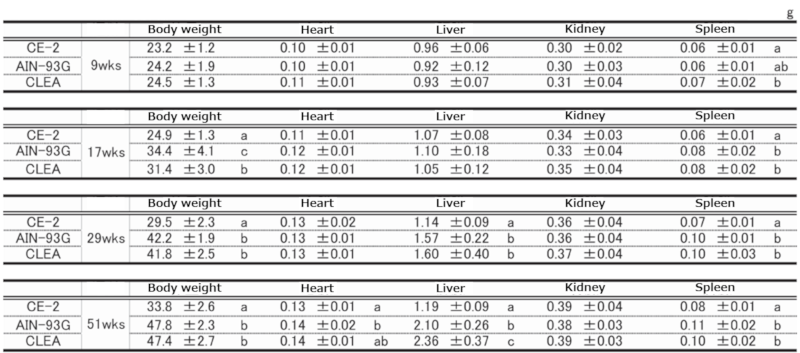
Table 9. Organ weights at necropsy in female mice.
Significant differences are indicated by different signs (P < 0.05).
⑤.Blood Biochemical Parameters
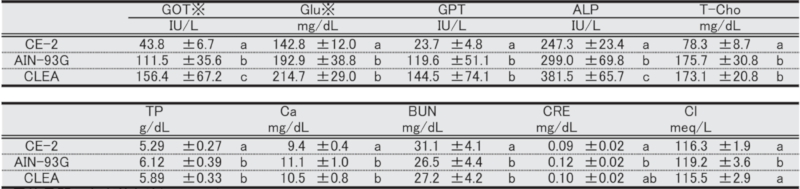
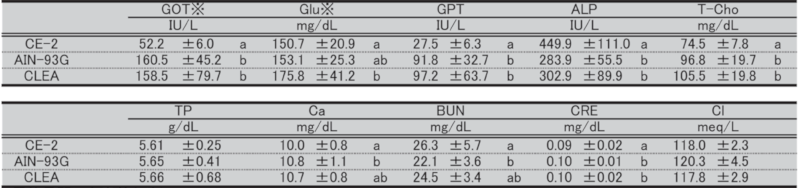
Table 10. Blood biochemical parameters in male mice at 9 weeks of age.
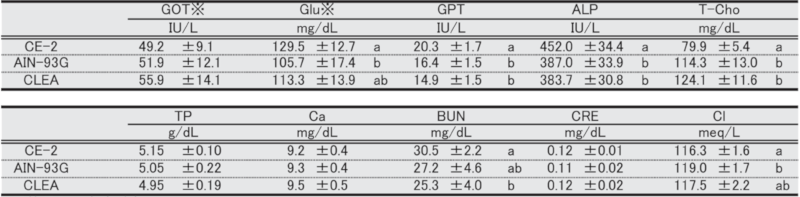
Significant differences are indicated by different signs (P < 0.05).
※: Measured in heparinized plasma.
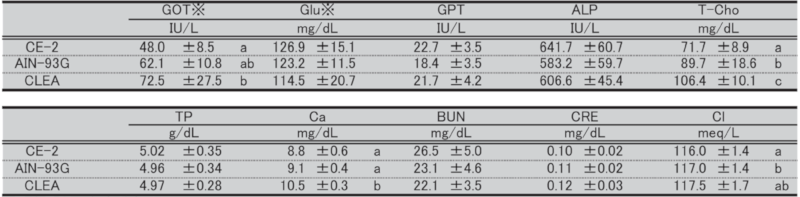
Table 11. Blood biochemical parameters in male mice at 17 weeks of age.
Significant differences are indicated by different signs (P < 0.05).
※: Measured in heparinized plasma.
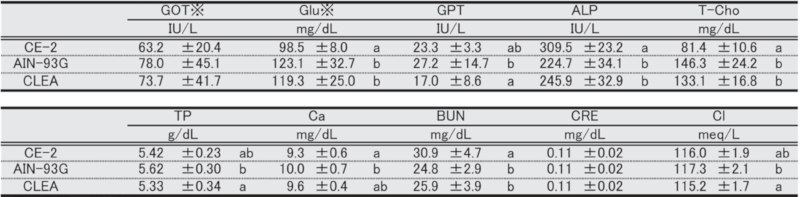
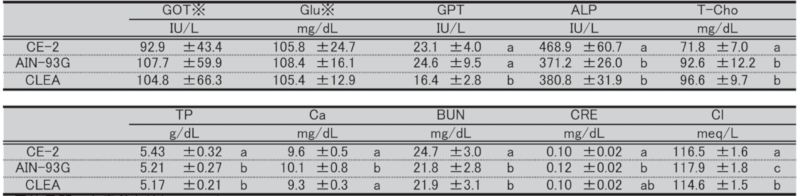
Table 12. Blood biochemical parameters in male mice at 29 weeks of age.
Significant differences are indicated by different signs (P < 0.05).
※: Measured in heparinized plasma.
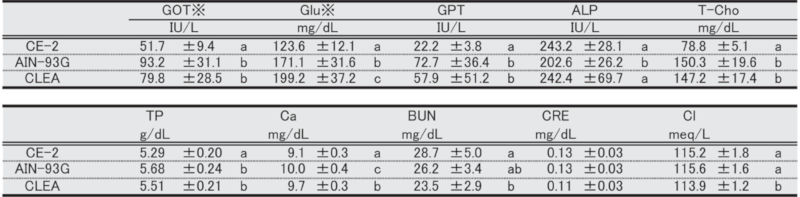
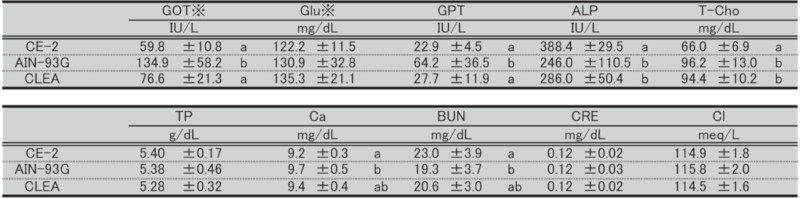
Table 13. Blood biochemical parameters in male mice at 51 weeks of age.
Significant differences are indicated by different signs (P < 0.05).
※: Measured in heparinized plasma.
Table 14. Blood biochemical parameters in female mice at 9 weeks of age.
Significant differences are indicated by different signs (P < 0.05).
※: Measured in heparinized plasma.
Table 15. Blood biochemical parameters in female mice at 17 weeks of age.
Significant differences are indicated by different signs (P < 0.05).
※: Measured in heparinized plasma.
Table 16. Blood biochemical parameters in female mice at 29 weeks of age.
Significant differences are indicated by different signs (P < 0.05).
※: Measured in heparinized plasma.
Table 17. Blood biochemical parameters in female mice at 51 weeks of age.
Significant differences are indicated by different signs (P < 0.05).
※: Measured in heparinized plasma.